The Causes of Rural Hospital Problems
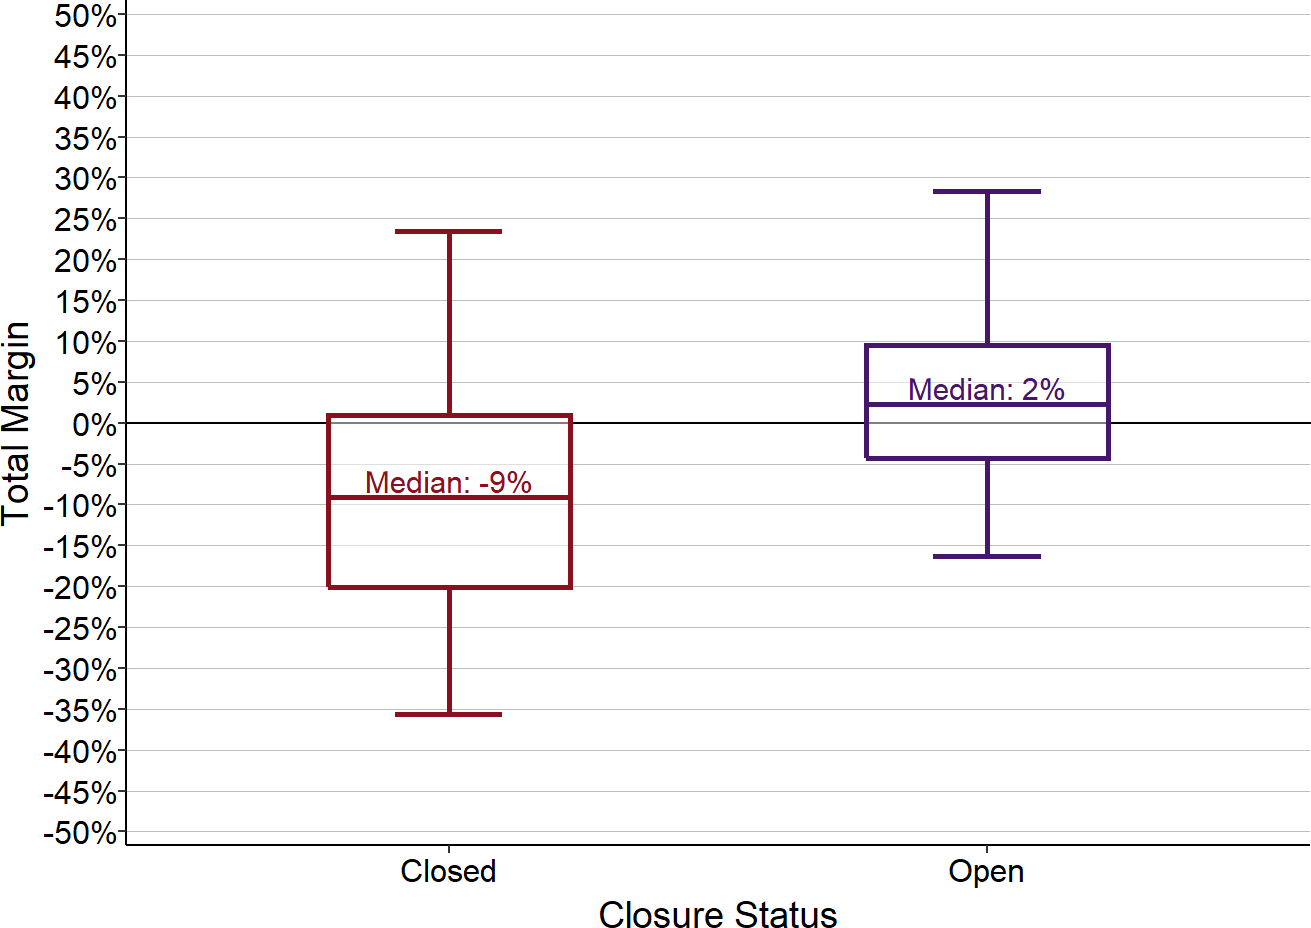
Rural hospitals are being forced to close because they are not paid enough to cover the cost of delivering care to patients in rural areas. Half of the small rural hospitals that have closed in recent years had losses of 9% or more in the year prior to closure, and over one-fourth had losses greater than 20%.
The primary causes of losses at the hospitals that closed were inadequate payments from both public and private health plans and inability of patients to pay their share of treatment costs. Most of the hospitals that closed had losses on patients with private health insurance as well as on Medicare, Medicaid, and uninsured charity care patients, and they did not have any other sources of income sufficient to offset these losses.
More than one-third of the rural hospitals that remain open have been losing money. Over 700 rural hospitals lost money in 2024, and nearly 400 had losses of 5% or more.
Small rural hospitals experienced greater financial losses on patient services during the pandemic, but they were able to continue operating because of the special federal pandemic aid that was available. However, this assistance was only temporary, and losses on patient services are likely to worsen in the future due to continued increases in costs.
Low payments from private health plans and patient bad debt are the primary causes of losses at small rural hospitals. At the majority of small rural hospitals, losses on patients with private health insurance plans and self-pay patients were greater than losses on Medicare, Medicaid, and uninsured charity care patients combined, although the magnitude of the losses varies significantly across states. Private health plans pay small rural hospitals less than they pay larger hospitals for the same services, and Medicare Advantage plans appear to be among the worst payers at small rural hospitals. Most small rural hospitals operate one or more Rural Health Clinics, and the low payments for primary care services from private payers are a major cause of losses at these hospitals.
The majority of rural hospitals lose money on Medicaid patients. The losses on individual Medicaid patients are generally larger than the losses on patients with private insurance. However, the much smaller proportion of Medicaid patients means that the overall impact on the hospital due to private insurance losses is still larger. In states that expanded Medicaid, hospitals experienced smaller losses on uninsured patients and bad debt, but losses on services to Medicaid patients increased due to low payments for services.
Medicare payments do not cause significant losses at most small rural hospitals. Most small rural hospitals are classified as Critical Access Hospitals and receive cost-based payments from Medicare.
Many small rural hospitals remain open only because they receive significant supplemental funding from local taxes or state grants. Two-thirds of small rural hospitals lose money on the delivery of patient services, but half of those hospitals receive enough revenue from other sources to maintain a positive overall margin. Small rural hospitals in some states are organized as public hospital districts, and residents of these communities tax themselves to offset underpayments by private health plans and Medicaid.
There is tremendous variation across the country in both the magnitude of losses and the causes of losses at small rural hospitals. In many states, low payments from private insurance plans are the primary cause of financial problems in small rural hospitals, but in other states, low Medicaid payments and low rates of insurance coverage are the largest single cause of losses. In some states, state grants or local taxes reduce or eliminate losses at small rural hospitals, while there is little or no such assistance for hospitals in other states.
Changes in payments from all payers will be needed to eliminate losses at small rural hospitals. No individual payer (Medicare, Medicaid, or a private insurance plan) is the sole cause of financial losses at small rural hospitals, and the relative magnitude of the contributions of each type of payer varies from state to state and hospital to hospital, so multi-payer solutions will be needed to solve the problem of rural hospital closures.
The Magnitude of Financial Losses at Rural Hospitals
Losses at Rural Hospitals That Closed
Most of the rural1 hospitals that have closed were forced to do so because the hospital could not afford to pay for the staff and supplies needed to continue delivering services to patients. The rural hospitals that closed since 20122 had a median loss of 9% in the year prior to closure, and one-fourth had losses of 20% or more.3 In contrast, the majority of rural hospitals that have not closed have had small but positive total margins.4
Figure 1
Total Margin (Profit/Loss) in Rural Hospitals
Closed hospitals include all rural hospitals that closed since 2012. For open hospitals, the margin (i.e., profit or loss as a percentage of total expenses) for the most recent year is used. For closed hospitals, the margin for the most recent year before closure is used. The bottom of each box shows the 1st quartile (i.e., 25% of the hospitals have a margin lower than this amount), the top of the box shows the 3rd quartile, and the center line represents the median value for the category (i.e., 50% of the hospitals are above or below this amount). The ends of the “whiskers” above and below each box represent the 5th and 95th percentiles, i.e., the margins for 90% of the hospitals in the category are between these amounts.
Closures do not occur suddenly or because a hospital loses money in one single year. Instead, hospitals that close typically experience losses for several years and reach the point where they no longer have sufficient financial reserves available to cover their losses and no method of paying their staff or creditors.
In the rural hospitals that have closed since 2015, persistent annual losses in the years prior to closure had reduced the hospitals’ resources to the point where the majority had current liabilities that exceeded current assets5 in the year before they closed.
Figure 2
Financial Trend Prior to Closure of Rural Hospitals
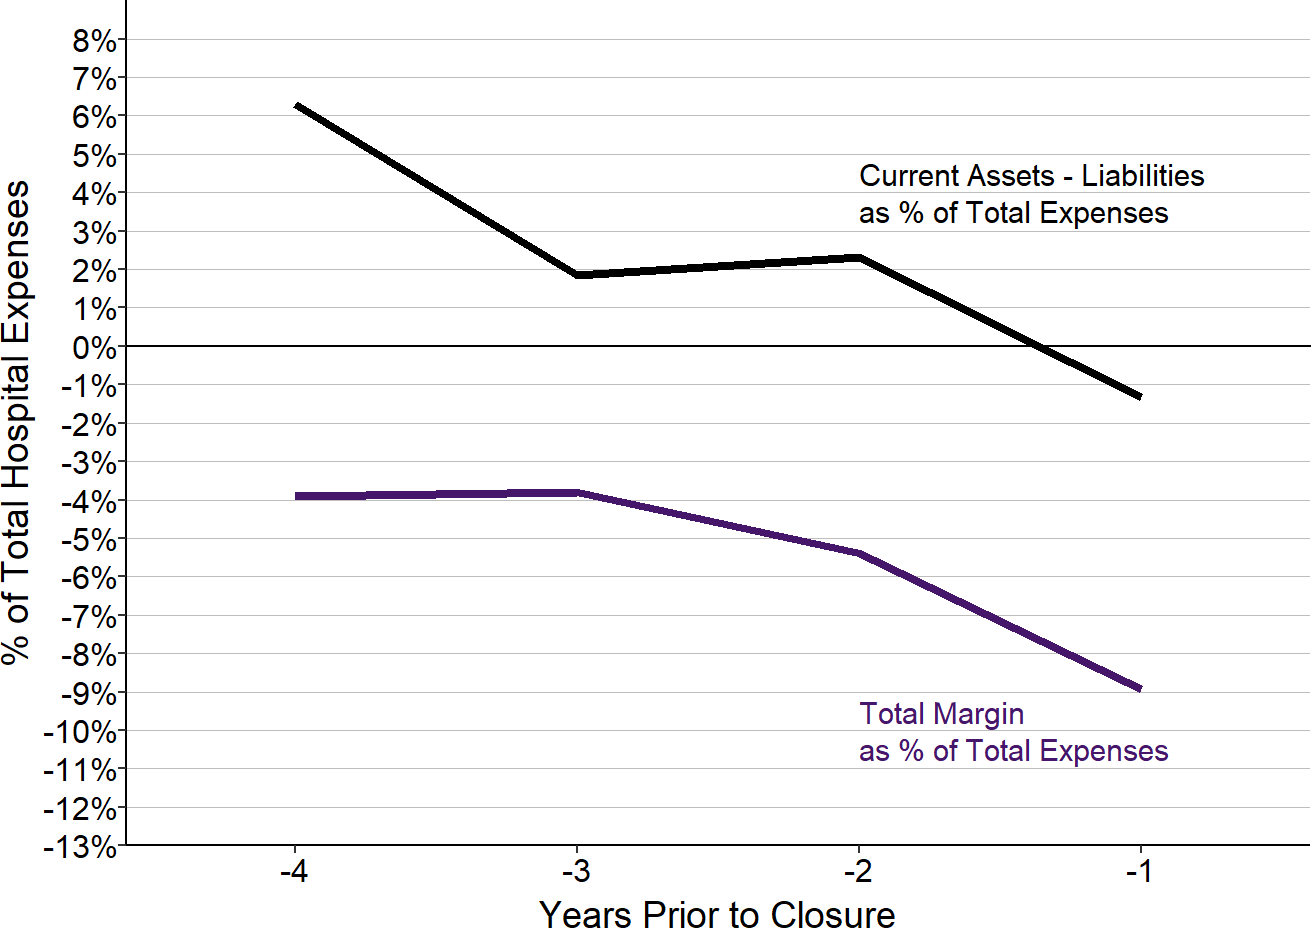
Values shown are the median amounts for rural hospitals that closed after 2015.
Several of the rural hospitals that closed were owned by EmpowerHMS, a company that was indicted for fraudulent billing.6 However, these were originally community hospitals that only became part of EmpowerHMS because the hospitals were struggling financially and EmpowerHMS promised to rescue them.7 Other hospitals that closed had been bought or managed by individuals or companies that had promised to address their financial problems but failed to do so.8
Losses at Hospitals That Have Not Closed
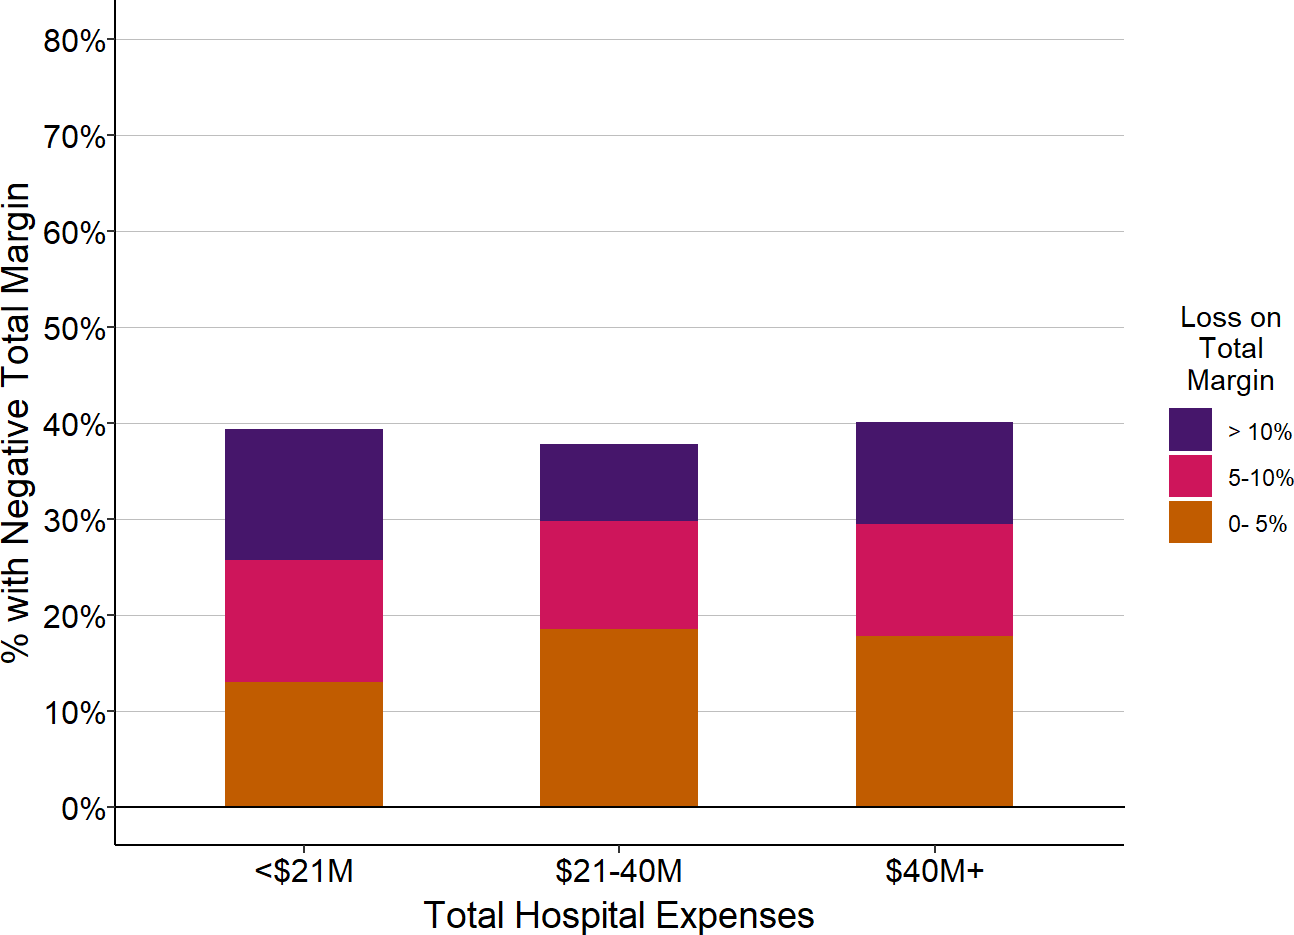
Although the majority of rural hospitals receive enough revenues to cover their costs, more than one-third do not. Almost 700 rural hospitals lost money in 2024, and over 350 had losses greater than 5%. More than 350 rural hospitals had losses prior to the pandemic as well as in 2024.9
Large, persistent losses deplete a hospital’s financial reserves, making it more likely it will have unpaid bills and difficulties in making payroll. Rural hospitals with financial losses and low reserves are the most susceptible to closure.
Although a significant proportion of rural hospitals of all sizes are losing money, the size of the losses are higher among the smallest rural hospitals, i.e., those in the lowest quartile of annual expenses ($24 million in 2024).10
Figure 3
Rural Hospitals Losing Money
| Total Hospital Expenses | Number of Rural Hospitals |
Percent with Total Margin < 0 |
Percent with Total Margin < -5% |
Percent with Total Margin < -10% |
|---|---|---|---|---|
| <$24M | 532 | 40.6% | 21.6% | 10.7% |
| $24-45M | 529 | 30.6% | 14.9% | 7.4% |
| $45M+ | 1,087 | 25.4% | 13.1% | 6.0% |
The chart shows the percentage of hospitals in each size category that had a median margin less than 0 in 2024, i.e., the hospital incurred a loss. If the median margin was lower than -5% or -10%, the hospital is included in the red or purple groups.
Hospitals that are losing money are at risk of closure, but even if a hospital does not close, large and persistent losses mean that the hospital will likely have to reduce the healthcare services it provides to the community. As a result, failure to address the significant financial problems facing the majority of these hospitals could lead to significant reductions in access to healthcare services for residents of many parts of the country.
Sources of Revenues in Rural Hospitals
Revenues at a hospital can be divided into four major categories:
- Health Insurance Plans: Since most patients have health insurance, the majority of revenues at every hospital comes from insurance plans. However, different insurance plans pay a hospital different amounts for the same service, and insurance plans pay different amounts for the same service at different hospitals. As a result, a hospital’s profitability will depend on the specific types of insurance its patients have and the amounts each of those plans pays the hospital for its services.
- Patients: Patients themselves are also an important source of revenue for hospitals. Obviously, if a patient has no insurance, the patient will be the primary payer for any services they receive. However, insured patients also serve as partial or even full payers for many of the services they receive because most health insurance plans require patients to pay copayments, co-insurance, and deductibles for services.11 In addition, if a service is not covered by the patient’s insurance plan, the patient will be responsible for the full charge. If patients cannot afford to pay some or all of the amounts they owe, this will reduce a hospital’s overall margin on services.
- Government Funding: Many rural hospitals receive government appropriations or tax revenues that are intended to support the hospital’s operations but are not directly tied to specific services for individual patients. For example, a number of rural hospitals are organized as public hospital districts and raise revenues from local tax levies. Some states provide special grants to rural hospitals to offset losses from the provision of care to uninsured patients.12
- Non-Patient Service Activities: Finally, most hospitals will receive some revenues for activities that are not directly associated with the hospital’s own healthcare services, e.g., operating a cafeteria, a gift shop, or a parking lot. Depending on the costs incurred for these activities, they may generate either a net profit or a loss for the hospital. In addition, a hospital will receive earnings on any investments it has made, and it may also have to pay interest on loans or bonds; the net revenue from these interest earnings and payments increases the total margin at some hospitals and reduces it at others.
The most detailed data available on the types of revenues received by hospitals come from the cost reports hospitals submit to the Centers for Medicare and Medicaid Services (CMS) each year. The cost reports do not allow revenues to be fully disaggregated into the categories above, but they do allow the following categories of revenues to be analyzed:
- Health Insurance Plans:
- Medicare Fee-For-Service: The most detailed information is available on payments associated with Medicare beneficiaries who are enrolled in “Original Medicare” (i.e., individuals who are enrolled in Medicare Part A and Part B and are not enrolled in a Medicare Advantage plan).13
- Medicaid: The cost reports include the total amount the hospital receives for services delivered to patients on Medicaid. This includes both payments hospitals receive directly from the state Medicaid agency as well as payments received from the Medicaid Managed Care Organizations (MCOs) that serve as payment intermediaries in many states.14
- CHIP and Indigent Care. Hospitals identify any payments for patients who are enrolled in Children’s Health Insurance Programs (CHIP) and state indigent care programs.
- Private/Other Payers: The remaining revenue from patient services – i.e., the total net revenue the hospital receives for all patient services15 minus the payments in the four categories above – represents the total amount of payments received from three types of payers: (1) private insurance plans (including Medicare Advantage plans16), (2) other governmental insurance programs17, and (3) self-pay patients.18 Since most of the revenue in this category typically comes from private insurance plans and patients, the analyses below will generally refer to this category of payers as “private payers” and the patients as “private-pay patients.”
- Patients:
- Patient Bad Debt: The cost reports do not distinguish how much of the revenue in the Private/Other Payers category comes directly from patients rather than insurance plans. However, the reports do include information on patient bad debt, i.e., what patients owe but fail to pay.19 This includes both unpaid amounts of cost-sharing for patients with insurance as well as unpaid amounts for uninsured patients who do not qualify for charity care. (Amounts that a health plan owes the hospital but does not pay are also considered bad debt on the hospital’s books, but these amounts are not included as “bad debt” on the Medicare cost reports.)
- Uninsured Charity Care Patients: Hospitals report the amount of revenues they would have received for services they delivered to patients who did not have insurance and who met the hospital’s standards for charity care.20
- Other. Revenues that are not directly associated with patient services are reported separately on the cost reports. This includes payments from governmental sources that are intended to offset losses on patient services, but are not tied directly to the number or types of services that individual patients receive, such as local tax levies and state grants. However, hospitals vary in how they classify these payments, and many hospitals report all or most other revenues simply as “other revenue,” so it is impossible to reliably separate government grants, tax levies, etc. from other sources for all hospitals.
More than half (52%-59%) of patient services are associated with patients insured by private insurance companies and patients who pay for their care directly. Less than 1/3 (24%-33%) of services are associated with patients who have coverage under Original Medicare. Medicaid represents less than 15% of the patient services at rural hospitals, and charity care represents less than 2% of rural hospital services.
Figure 4
Payers for Patient Services at Rural Hospitals
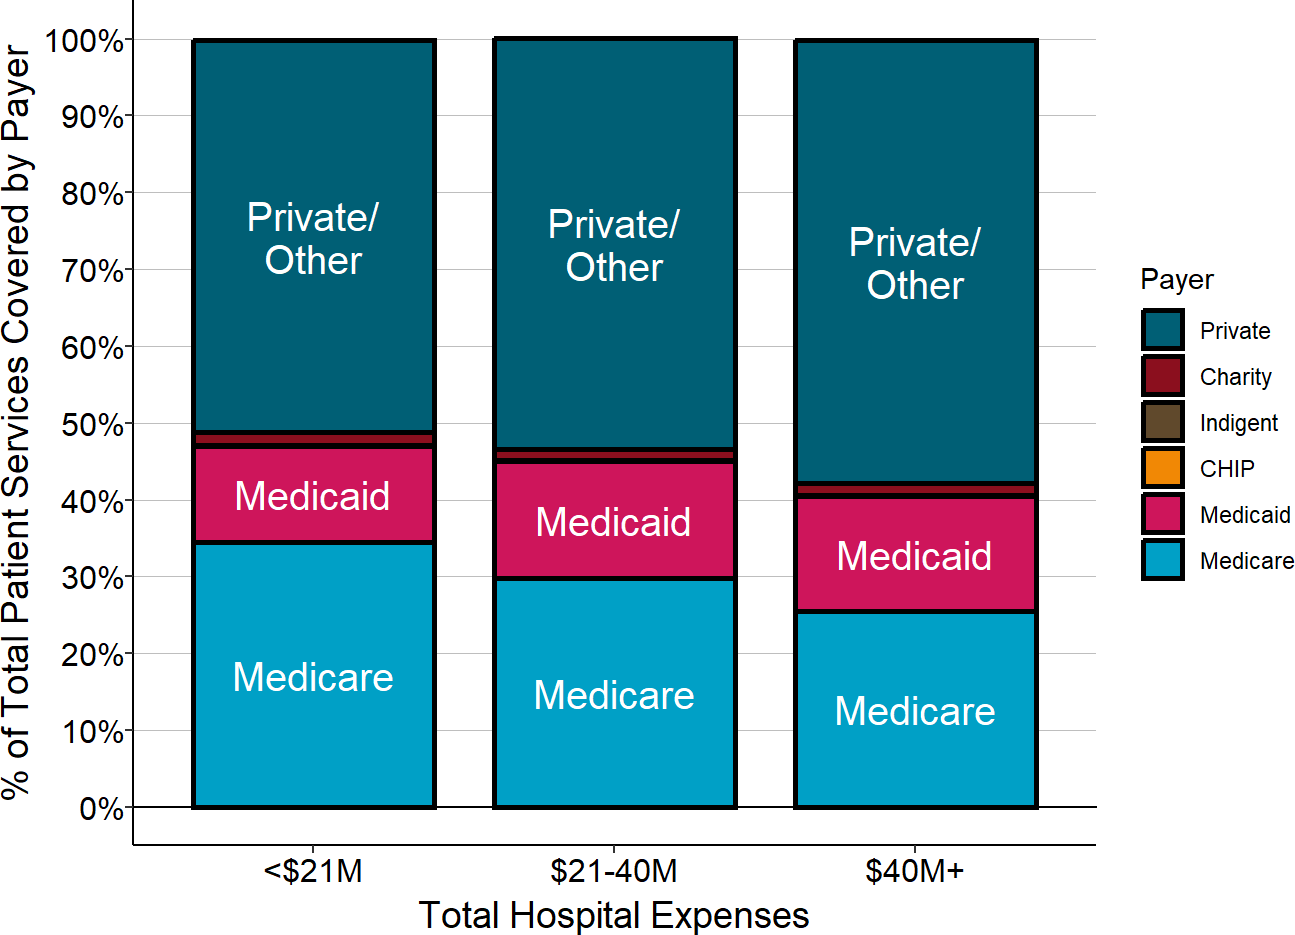
The payer share is based on the estimated proportion of the hospital’s patient service costs for patients paid for by that payer. The value for each hospital is the median for the three most recent years available.
A portion of the patients with private insurance are Medicare beneficiaries who have a Medicare Advantage plan, so the proportion of services delivered to Medicare beneficiaries is higher than what is shown in the chart. However, Medicare Advantage plans are private companies and they are not required to pay the same amounts or use the same methods of payment that are used for patients in “Original Medicare,” so the figure accurately represents the different categories of payers that support the hospital’s services.21
It is important to recognize, however, that even though the differences in payer mix between smaller and larger hospitals are relatively small on average, individual hospitals can have very different mixes of payers. For example, some hospitals have much larger percentages of Medicaid patients and/or uninsured patients, and this can cause greater financial losses for these hospitals. The proportion of Medicare beneficiaries who have selected a Medicare Advantage plan rather than Original Medicare varies significantly from state to state and also from county to county within individual states, and that can cause the proportion of patient services paid for directly by the Medicare program to vary significantly for individual hospitals. As will be discussed further below, this can have a significant impact on a hospital’s financial condition.
The vast majority of hospitals’ revenues and expenses are associated with services delivered to patients, so if a hospital is losing money overall, it is usually because the payments it receives for services are below the costs incurred in delivering services. However, many rural hospitals that are losing money on patient services receive a sufficient amount of money from taxes, grants, or profits on activities not directly related to patient services (e.g., a gift shop or parking lot) to offset those losses.
This “other revenue,” i.e., revenue that is not directly tied to patient services, represented 14% of the total revenues at the smallest rural hospitals (those with less than $24 million in annual expenses), and 12% of revenues at rural hospitals with annual expenses between $24 million and $45 million, compared to only 8% at larger rural hospitals.
Figure 5
Revenue from Patient Services vs. Other Sources
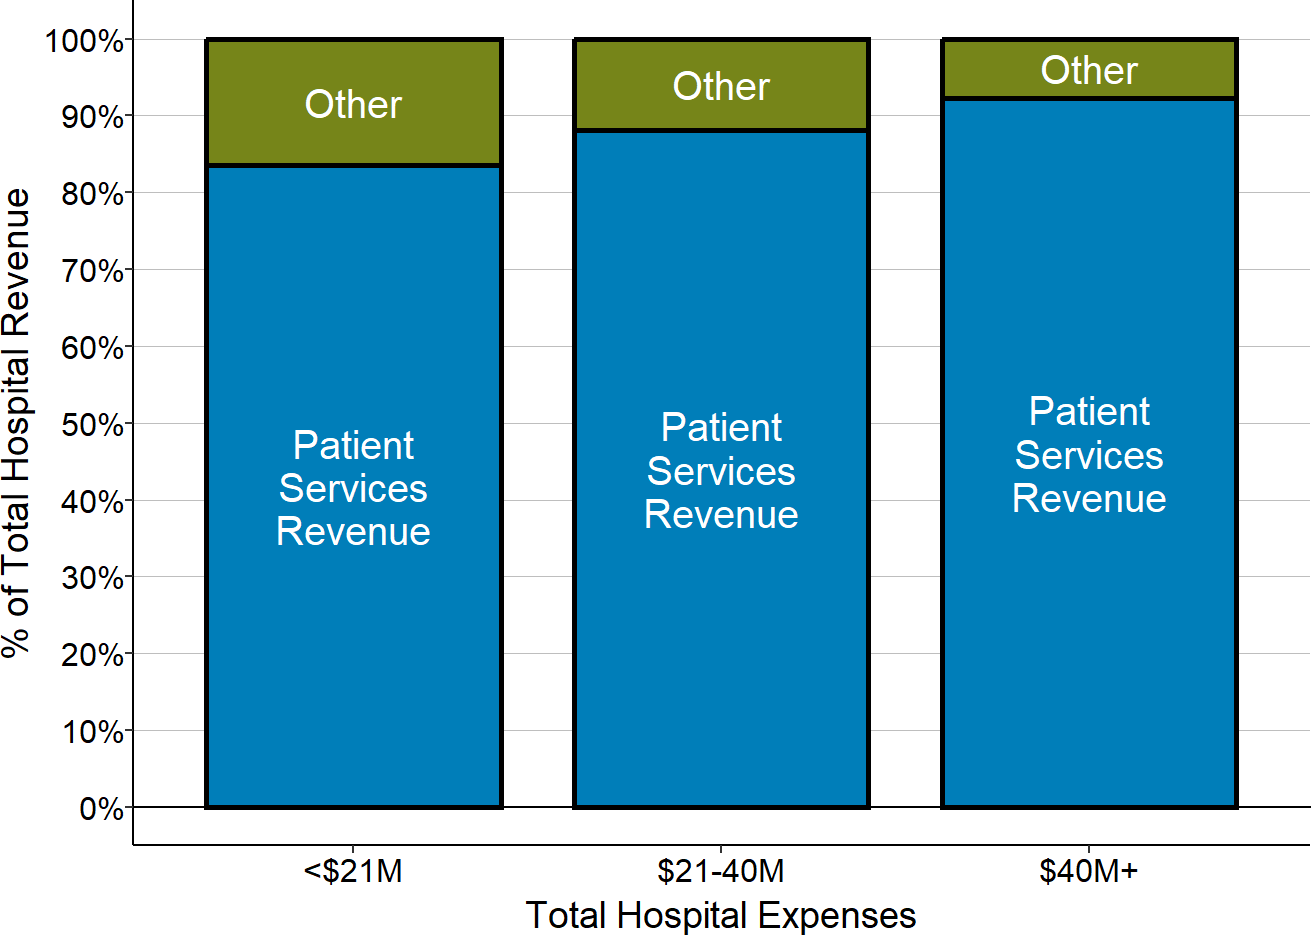
During the pandemic, the proportion of rural hospitals’ total revenue coming from “other revenue” increased dramatically because of the large grants rural hospitals received from federal pandemic assistance programs. For example, in 2020, at rural hospitals with less than $24 million in annual revenue, an average of 20% of their total revenue came from sources other than patient services. This is discussed in more detail below in The Impact of the Pandemic on Rural Hospitals.
Causes of Losses in Rural Hospitals
Understanding why some rural hospitals are losing money and why others are not requires determining not only how much each hospital receives from each category of payer, but how that revenue compares to the costs of the services the hospital delivered to the patients associated with that payer. Each category of payer described above can contribute either positively or negatively to the hospital’s overall profit or loss, depending on whether the amount paid was higher or lower than the cost of the associated services delivered by the hospital.
Measuring Payer-Specific Costs
Calculating payer-specific margins requires knowing not only the revenues the hospital receives from that payer but also the cost of the services received by the patients associated with that payer. These costs have to be estimated, and this is challenging to do accurately and fairly.
( on the challenges in determining payer-specific costs.)
Most of the costs incurred by a hospital are for facilities, equipment, and personnel that do not change when one more patient or one fewer patient receives a service, which means that the marginal (i.e., incremental) cost of delivering even a complex service to an individual patient is very small. For example, when a patient visits the Emergency Department, even with a serious condition, the hospital will not incur any significant additional expense in the ED to diagnose and treat the condition, because it will not need to hire additional physicians or purchase any additional equipment to do so.22
Although the incremental cost of each service is small, no patient could receive any service at all if the hospital does not have adequate staff and equipment available, and so some portion of that overall cost must be recovered from each patient. A way to measure this is to calculate the average cost per service, i.e., divide the total cost of the service line by the total number of services delivered. However, since some services require more time than others (e.g., a longer ED visit or a lab test that takes longer to perform), it would be misleading to assign the same average cost to every patient, regardless of the intensity of the service they received.
In order to adjust the average cost based on the intensity of individual services, the standard approach is to use the amount the hospital charges for a service as a measure of the relative intensity of the service. (This assumes that a hospital will charge more for delivering a higher-intensity service.) The amount the hospital charged for the service is used (i.e., the hospital’s “full price” for the service), not the amount that it was actually paid for the service, because the charge for a service is the same for every patient, whereas different payers pay very different amounts for services, and some patients cannot afford to pay anything at all.
The cost of an individual hospital service is generally estimated by first calculating the “cost-to-charge ratio” for the service line (e.g., the ED or the laboratory), and then multiplying the amount the hospital charged for the individual service (e.g., the ED visit or the specific laboratory test that was performed) by that ratio. For example, if the total cost of operating the hospital Emergency Department is $2 million, and the total amount that the hospital charged for all ED visits was $4 million, then the cost-to-charge ratio for the Emergency Department would be 0.5. If an individual patient made a visit to the ED and the hospital charged $200 for that visit, the cost of the visit would be estimated to be $100 ($200 x 0.5).
Using this service-line specific approach to determine cost of services delivered to patients insured by a specific payer or category of payers requires knowing how much the hospital billed those payers for services in each separate service line. Hospital cost reports are required to provide this level of detail for Medicare fee-for-service beneficiaries, but not for other payers. When only the total charges for a group of patients is known, but not the service-line specific charges, what is typically done is to calculate an overall cost-to-charge ratio for the entire hospital, and to use that for all service lines rather than service-line specific cost-to-charge ratios. For example, although Medicare requires hospitals to estimate the cost of services delivered to Medicare beneficiaries using service line cost-to-charge ratios, it only requires the hospital to estimate the cost of services to Medicaid patients using the aggregate (non-service specific) cost-to-charge ratio for the hospital because hospitals do not separately record the amounts charged for each category of services delivered to Medicaid patients.
Caution is needed when using a single cost-to-charge ratio for the entire hospital because it can be less accurate than a service-line specific approach for specific hospitals or specific payers. This is because the cost-to-charge ratio typically varies dramatically from service line to service line at most hospitals. For example, the cost-to-charge ratio for an ED visit might be 0.5, but the cost-to-charge ratio for a laboratory test might be only 0.25 (i.e., on average, the hospital charges four times as much for lab tests as it costs to deliver them) or even less. If some payers’ patients receive a different mix of services than the patients of other payers, the cost of services ascribed to some payers will be underestimated and the costs will be overestimated for others.23
The magnitude of the inaccuracy will depend on the extent to which different sets of patients use very different types of services at a hospital and the extent to which some hospitals set higher charges relative to costs in specific service lines more than other hospitals do. One study that examined the issue using data on California hospitals concluded that overall, the error was relatively small, but it is not clear whether similar conclusions would be drawn for other hospitals or more recent years.24 However, even the service line-specific approach will be inaccurate if hospitals set the charges for some services in a service line using a much higher mark-up than other services, and comparisons of costs and margins across hospitals will be inaccurate when different hospitals set their charges in different ways.25
The cost estimates used in the margin calculations shown below are calculated using the most detailed level of information about services and charges included in Medicare cost reports. The estimates are most accurate for Original Medicare patients because the charges for them are reported separately for each individual service line. Costs for Medicaid and private-pay patients can generally only be estimated at a service line level for inpatient care, not for any other service line.
Measuring Payer-Specific Margins
The amount that each payer contributes to the hospital’s overall profit or loss can be measured in two ways:
- The margin (profit or loss) on the services delivered to the patients with a specific type of payer. The dollar amount of margin is determined by subtracting the estimated cost of the services delivered from the amount of revenue received from the payer.26 The percentage margin is then determined by dividing that dollar margin by the cost of the services.27 For example, if the margin on Original Medicare patients is -10% at a particular hospital, it means that Medicare paid 10% less than the cost of delivering the services patients with Original Medicare received at that hospital.
- The payer’s percentage contribution to the hospital’s total profit or loss. A large percentage profit or loss on a particular payer’s patients will only have a large impact on the hospital’s overall profitability if that payer insures a large percentage of the hospital’s patients. The contribution made by a particular payer to the hospital’s overall profitability is determined by comparing the dollar amount of profits and losses from that payer to the profits and losses from all of the other payers. To measure this, the dollar amount of margin associated with a payer is divided by the hospital’s total expenses, rather than just the cost associated with that payer’s patients.28 For example, if services to Medicare patients represent 40% of the hospital’s total costs, then a -10% margin on the Medicare patients reduces the hospital’s overall margin by -4% (-10% times 40%).
Each of these two measures conveys different and important information:
- The first measure (margin on the payer’s patients) conveys the extent to which an individual payer is covering the costs of delivering services to its patients.
- The second measure (payer contribution to the hospital’s total margin) conveys the amount by which that payer is increasing or decreasing the hospital’s overall profitability.
Because of the large differences in the relative sizes of different categories of payers and the variations in payer mix across hospitals, the payers that generate the highest profits or losses on the first measure can turn out to be less important to the hospital’s overall profitability than the payers who insure the largest numbers of patients.29
Causes of Losses at Hospitals That Closed
The causes of financial losses differ significantly between the small rural hospitals that have closed and larger rural hospitals. As shown below, the majority of larger rural hospitals (i.e., those with total expenses above the median for rural hospitals) made significant profits on patients with private insurance, but those profits were not sufficient to offset the losses on Medicare, Medicaid, and bad debt. In contrast, the majority of small rural hospitals had losses on patients with private insurance, so the hospital had no way to offset losses from uninsured patients and low Medicaid payments. Although the small hospitals received more revenue from sources other than patient services than larger hospitals, it was not sufficient in most cases to offset the losses on patient services.
Figure 6
Components of Total Margin
Small Rural Hospitals That Closed
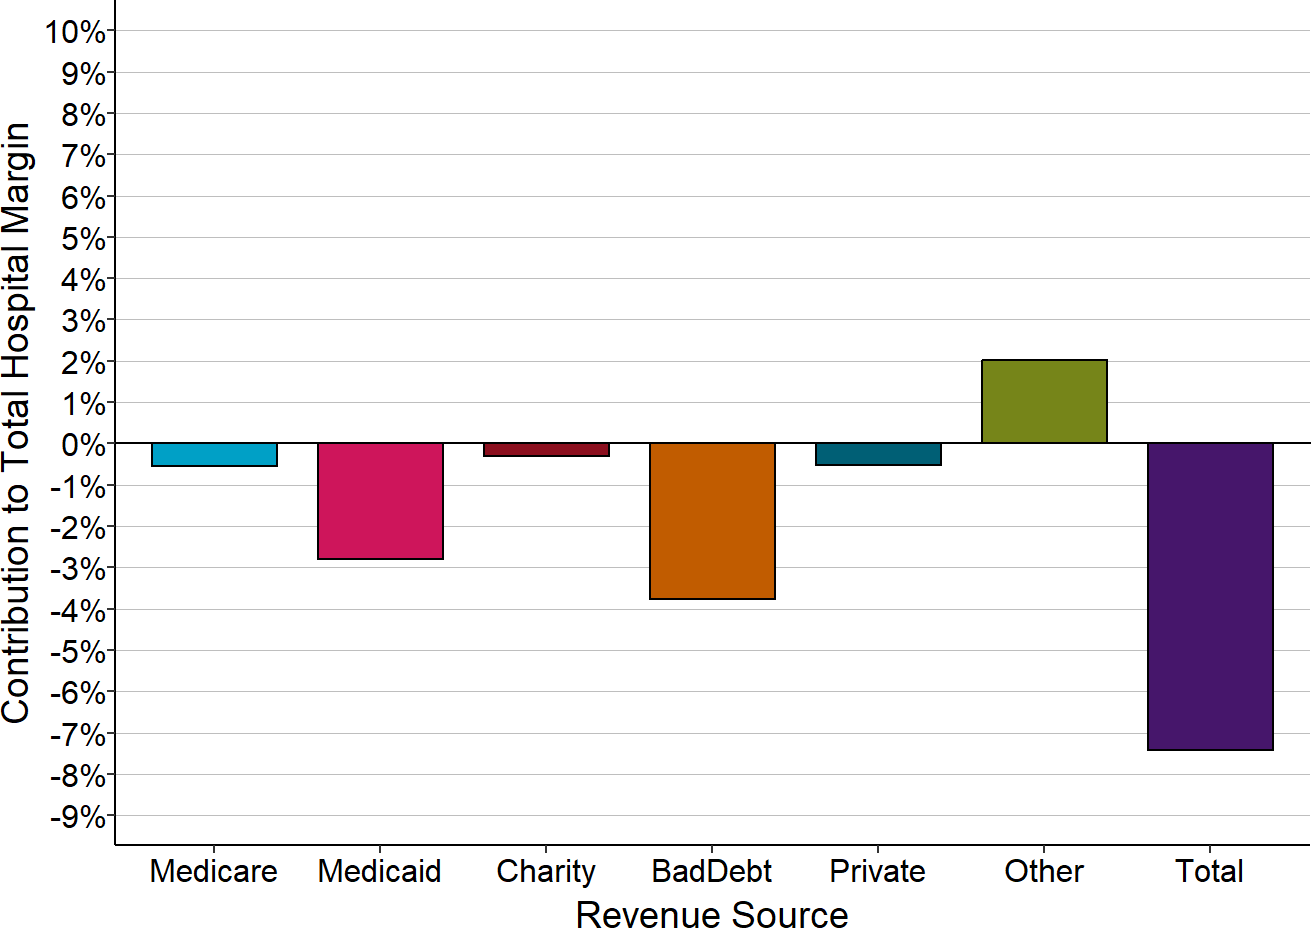
The Contribution to Total Hospital Margin for a specific payer is the dollar margin (i.e., the amount of profit or loss) earned on services delivered to patients insured by that payer, divided by the hospital’s total expenses for all patients. The amounts shown are the medians for the 3 years prior to the hospital’s closure. “Small” rural hospitals are those with total annual expenses less than the median expenses for rural hospitals in the year prior to closure.
Figure 7
Components of Total Margin
Larger Rural Hospitals That Closed
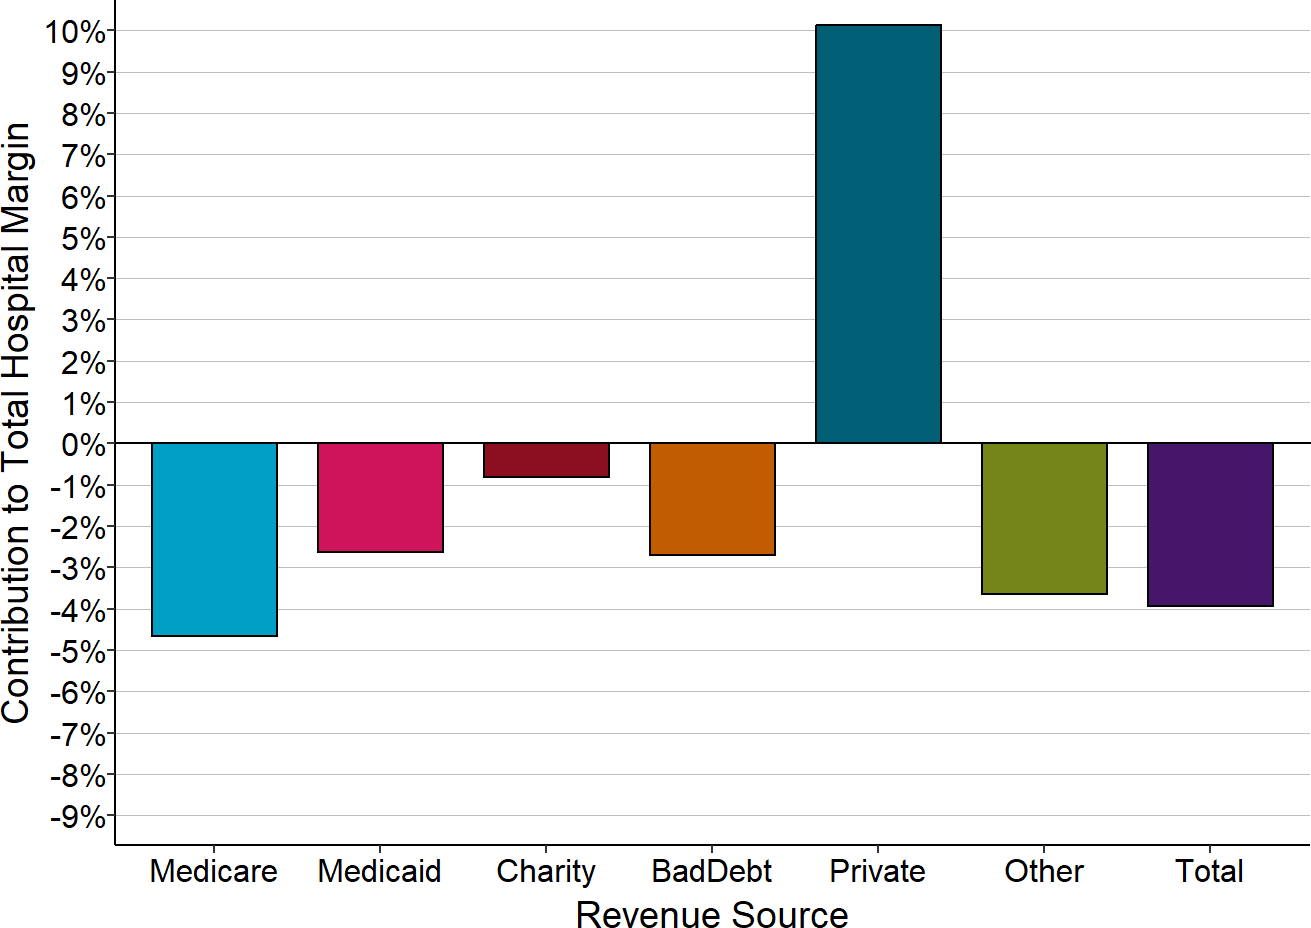
The Contribution to Total Hospital Margin for a specific payer is the dollar margin (i.e., the amount of profit or loss) earned on services delivered to patients insured by that payer, divided by the hospital’s total expenses for all patients. The amounts shown are the medians for the 3 years prior to the hospital’s closure. “Larger” rural hospitals are those with total annual expenses greater than or equal to the median expenses for rural hospitals in the year prior to closure.
The small rural hospitals that did not close had smaller losses on Medicaid and bad debt, but the biggest reason most of the hospitals have remained open is that they have received other types of revenue, such as local tax revenues, that are sufficient to offset the losses on both insured and uninsured patients.
Figure 8
Components of Total Margin
Small Rural Hospitals That Closed
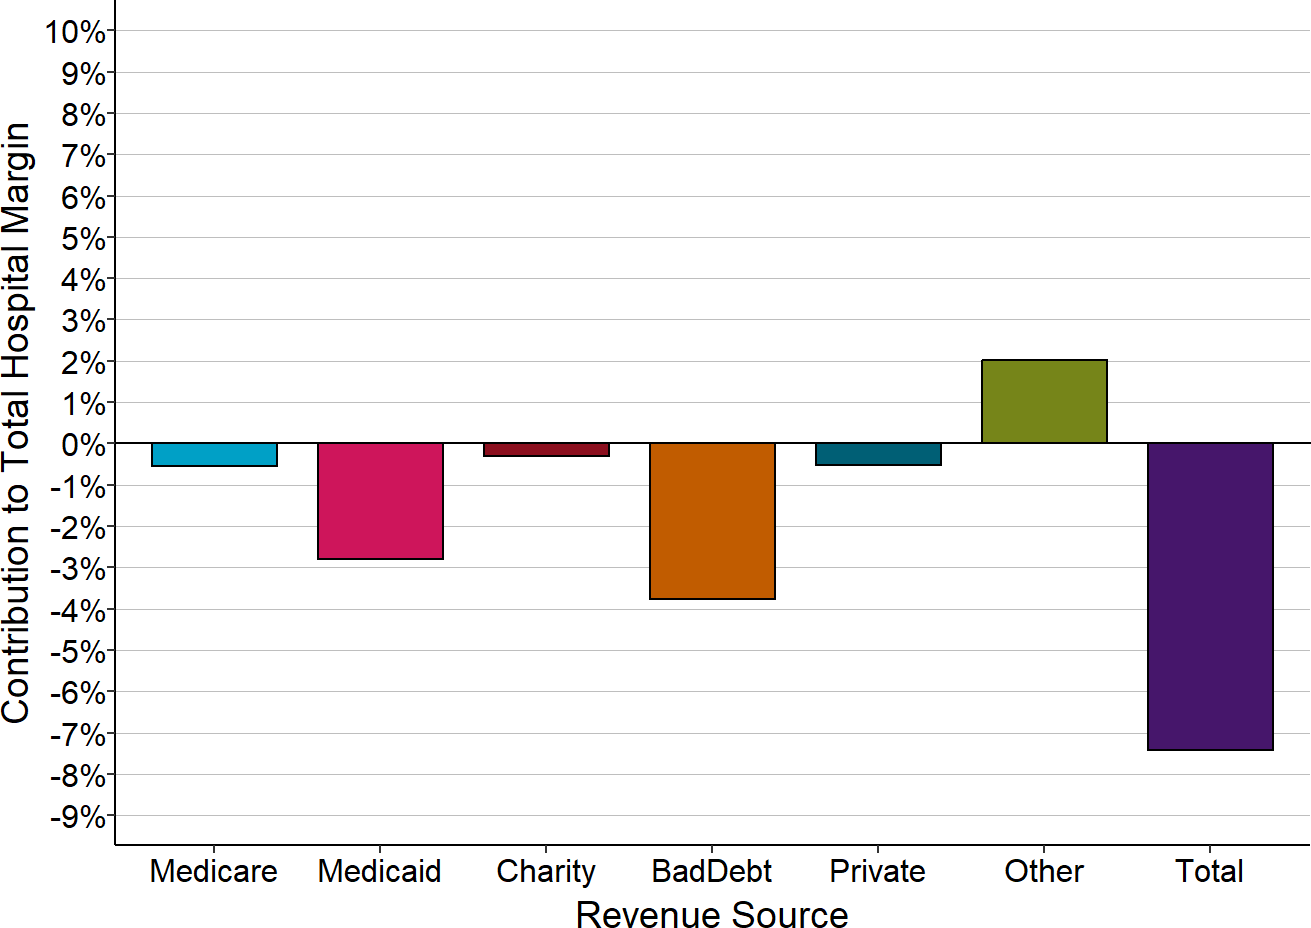
The Contribution to Total Hospital Margin for a specific payer is the dollar margin (i.e., the amount of profit or loss) earned on services delivered to patients insured by that payer, divided by the hospital’s total expenses for all patients. The amounts shown are the medians for the 3 years prior to the hospital’s closure. “Small” rural hospitals are those with total annual expenses less than the median expenses for rural hospitals in the year prior to closure.
Figure 9
Components of Total Margin
Small Rural Hospitals That Have Not Closed
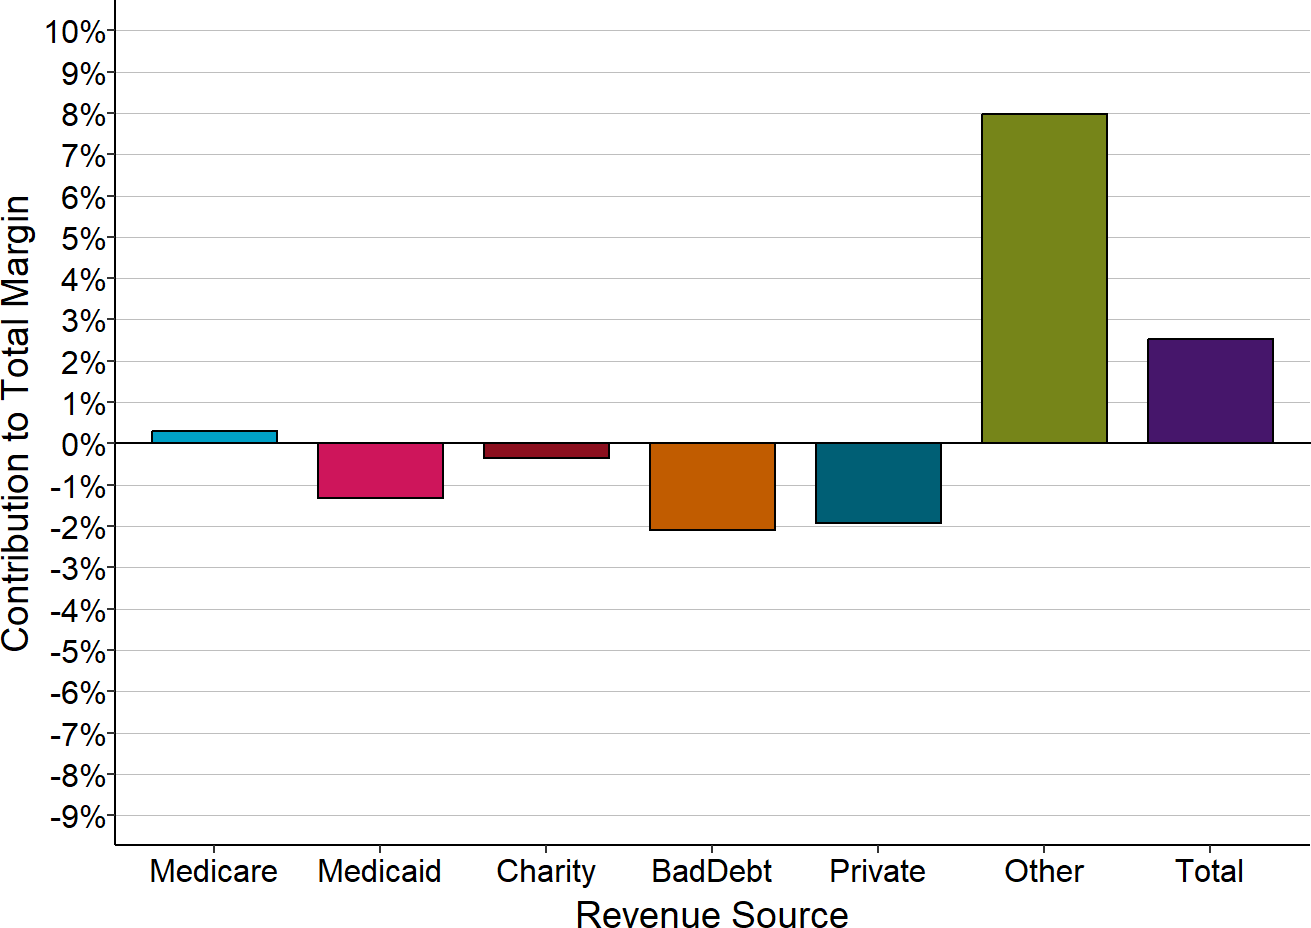
The Contribution to Total Hospital Margin for a specific payer is the dollar margin (i.e., the amount of profit or loss) earned in the most recent year available on services delivered to patients insured by that payer, divided by the hospital’s total expenses for all patients. “Small” rural hospitals are those that were open in 2025 and had annual expenses in 2024 less than the median expenses for rural hospitals ($45 million).
Causes of Losses in the Smallest Rural Hospitals
Figure 9 masks significant differences between the smallest rural hospitals – those with less than $24 million in total annual expenses – and the small rural hospitals that are somewhat larger.
The charts below show how the different revenue categories contribute to the total margins at the hospitals with less than $24 million in annual expenses, and at the hospitals with $24-45 million in annual expenses.
Figure 10
Components of Total Margin
Rural Hospitals <$24M Total Expenses
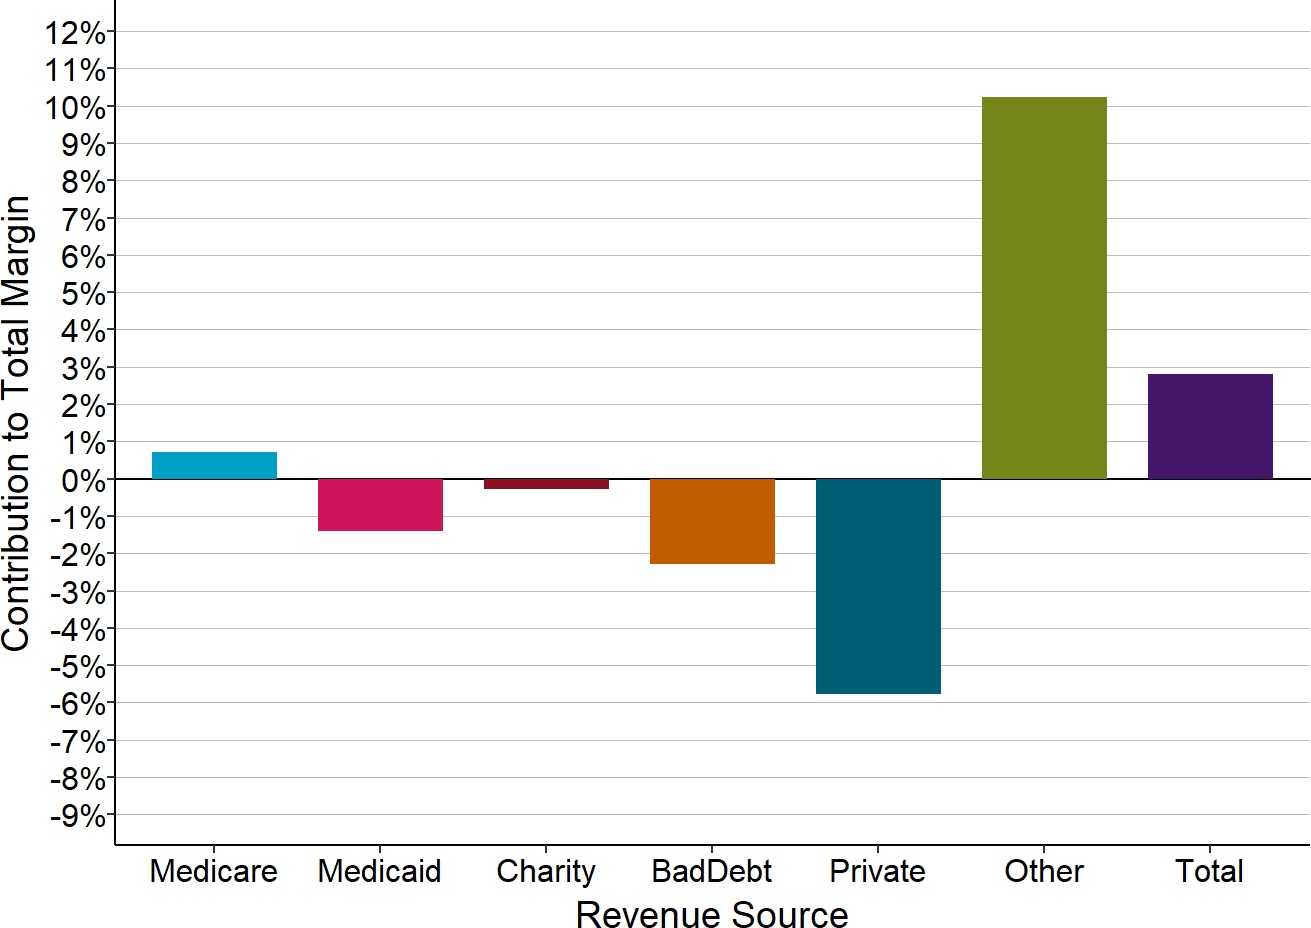
The Contribution to Total Hospital Margin for a specific payer is the dollar margin (i.e., the amount of profit or loss) earned on services delivered to patients insured by that payer, divided by the hospital’s total expenses for all patients. The amounts shown are the medians for all rural hospitals with less than $24 million in annual expenses that were open in 2025.
Figure 11
Components of Total Margin
Rural Hospitals $24-45M Total Expenses
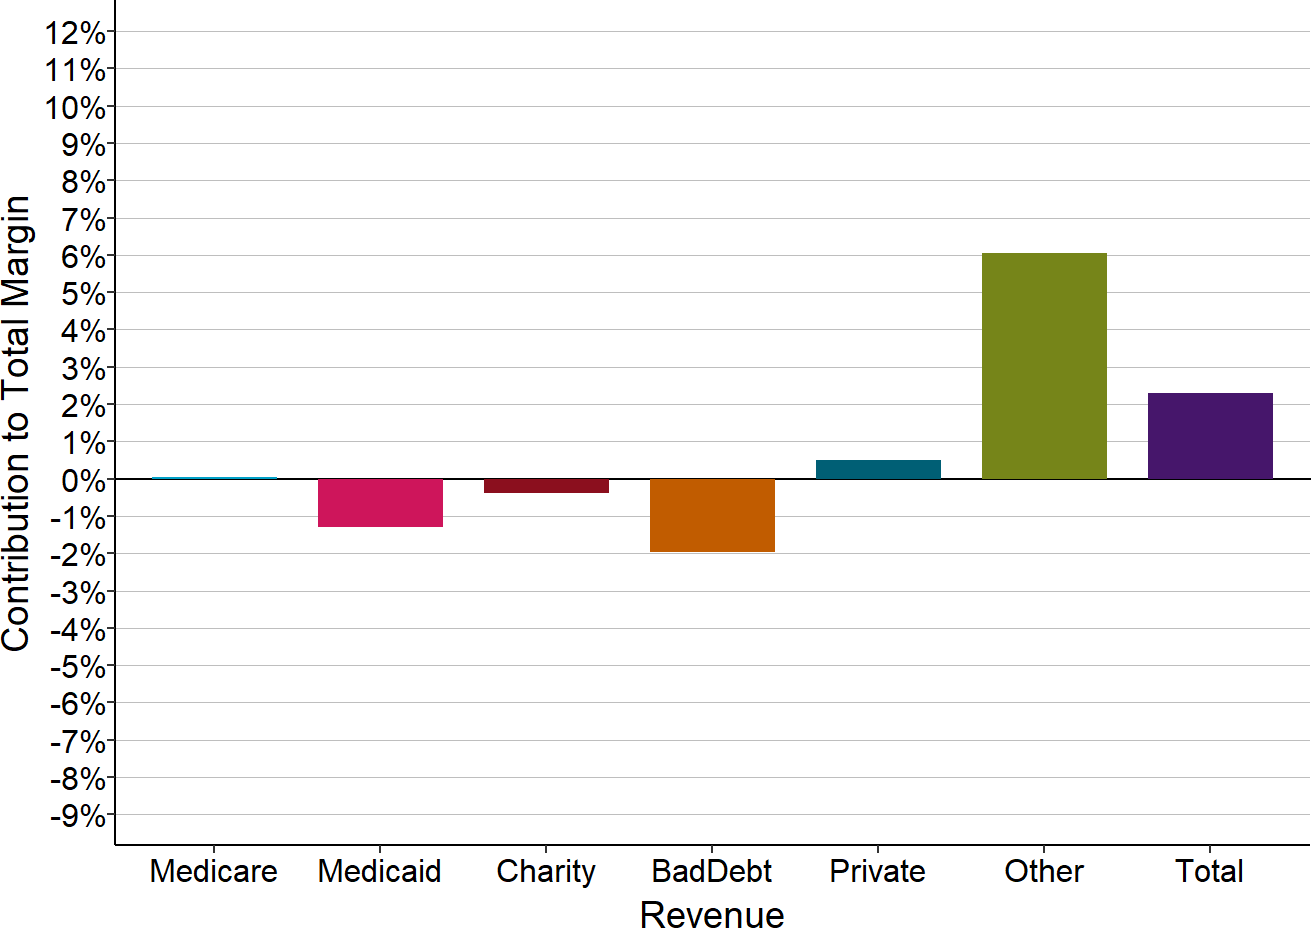
The Contribution to Total Hospital Margin for a specific payer is the dollar margin (i.e., the amount of profit or loss) earned on services delivered to patients insured by that payer, divided by the hospital’s total expenses for all patients. The amounts shown are the medians for all rural hospitals with more than $24 million but less than $45 million in annual expenses that were open in 2024.
Only two categories have differences that are both statistically significant and large in size:
- Patients with Private Insurance: The majority of the smallest hospitals lose money on patients with private insurance, whereas the majority of the larger hospitals make small profits on these patients. At the larger hospitals, the profits on private-pay patients are too small to offset the losses from bad debt much less losses on Medicaid and charity care, whereas the smallest hospitals lose large amounts on private-pay patients through a combination of payments below costs and patient bad debt.
- Other Revenues: Other revenues are much larger relative to total expenses and revenues at the smallest hospitals than at larger ones. Many of the smallest hospitals would have lost money overall had it not been for the revenues they received that were not tied directly to patient services.
The Role of Private Payers in Rural Hospital Losses
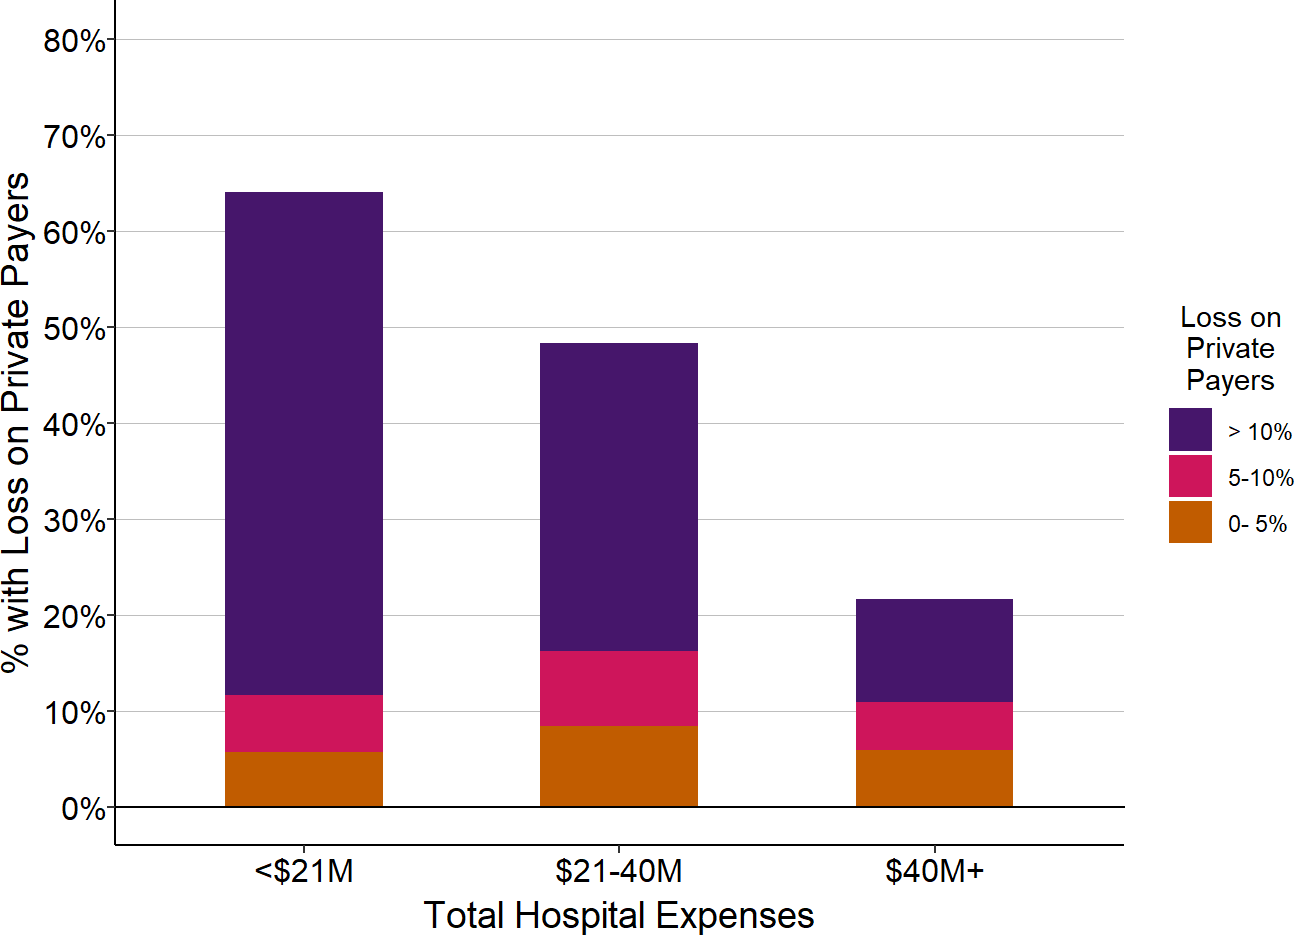
The smaller the hospital, the less likely it is that the hospital will make profits on private-pay patients and the more likely it will have losses. Moreover, the smaller the hospital, the larger the losses will be on private-pay patients. Because rural hospitals deliver about half of their services to private-pay patients, losses on those patients have a large impact on the hospital’s total margin.
Figure 12
Percentage of Rural Hospitals
With Losses on Patients with Private Insurance
| Total Hospital Expenses | Number of Rural Hospitals |
Percent with Loss on Privately Insured Patients |
Percent with Private Payer Loss 5-10% |
Percent with Private Payer Loss > 10% |
|---|---|---|---|---|
| <$24M | 507 | 61.1% | 54.2% | 47.3% |
| $24-45M | 515 | 41.6% | 32.8% | 24.1% |
| $45M+ | 1,067 | 19.6% | 14.4% | 10.0% |
The chart shows the percentage of rural hospitals in each size category that lost money on services to patients with private/other insurance during the most recent year. The purple bars represent the proportion of hospitals that lost 10% or more on services to patients with private insurance, and the red bars represent the proportion that lost 5-10% on services to patients insured by private insurance companies.
Low payments from private payers also help explain why, in every size category, some hospitals have bigger financial losses or smaller profits than others. Although rural hospitals deliver about half of their services to private-pay patients on average, the mix of patients varies significantly from hospital to hospital. If hospitals are paid less for patients with private insurance than patients with public insurance, then hospitals will do worse financially if they have more privately-insured patients, and vice versa.
Small rural hospitals lose slightly less on patient services if more than half of the services are paid for by private payers, but most small rural hospitals lose money overall regardless of whether they have higher or lower percentages of patients insured by private insurance companies. In contrast, larger hospitals make higher profits on patient services if they have a higher share of privately-insured patients, because at larger hospitals, payments for patients with private insurance are higher than the cost of services and offset losses on uninsured patients and patients insured by Medicaid.
Figure 13
Impact of Privately Insured Patients on Patient Service Margin
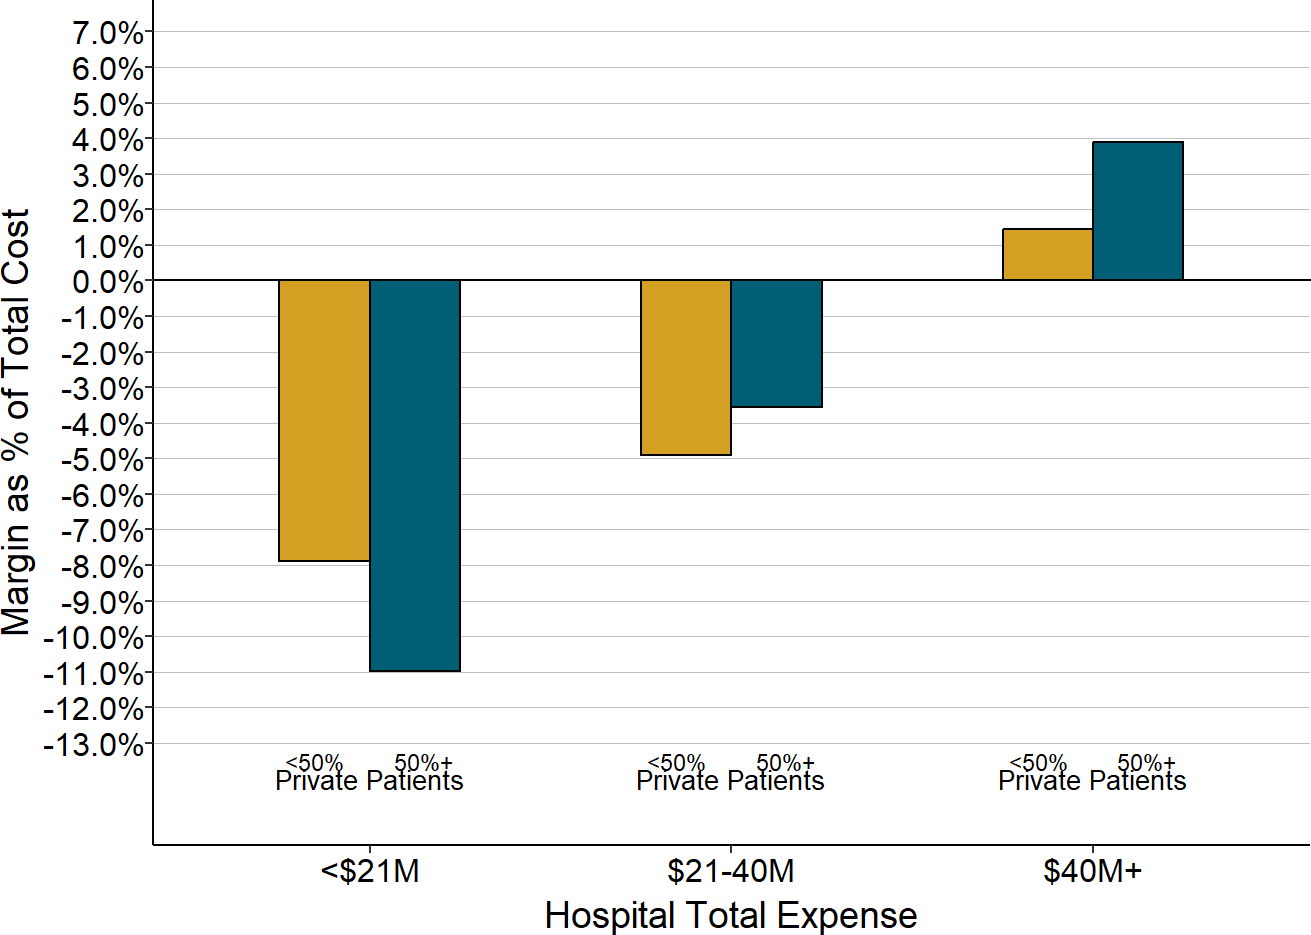
The value for each hospital is the median of the total annual margins (across all payers) at the hospital during the most recent year available. The chart shows the median amounts for all of the rural hospitals with total expenses in each category based on the percentage of the hospital’s patients with private insurance. “<50% Private Patients” means that less than 50% of the cost of all patient services at the hospital were associated with patients who had private insurance.
The amount that small hospitals lose on private-payer patients also depends on the kinds of services the hospital delivers. The majority of rural hospitals operate one or more Rural Health Clinics (RHCs) in order to ensure that the residents of their community have access to primary care services. On average, the RHCs represent about 1/6 of the hospitals’ patient service costs, so profits or losses on the clinics can have a large impact on the hospitals’ overall profitability.
Primary care is difficult to sustain financially everywhere, and it is particularly hard to sustain in small rural communities because of the significantly higher costs associated with delivering care to smaller patient populations. To support the higher costs of primary care in rural areas, Medicare pays for RHC services based on their actual costs when the RHC is operated by a rural hospital with less than 50 beds. The average cost per visit in 2025 at rural hospital-based RHCs was $293, and Medicare paid an average of $218 per visit at those RHCs, twice as much as what Medicare pays for visits at primary care practices and non-hospital-based RHCs.30
Private health plans, however, typically pay the same amounts for primary care services at hospital-based RHCs as they pay other primary care practices. Even if a plan pays more for primary care visits than the standard Medicare fees, those payments will still be less than the cost per visit at most RHCs. As shown below, small rural hospitals that operate a Rural Health Clinic lose significantly more on private payments than hospitals without an RHC, and larger hospitals that operate an RHC make smaller profits than hospitals that do not.
Figure 14
Private Payer Contribution
to Total Hospital Margin
By Presence of Rural Health Clinic (RHC)
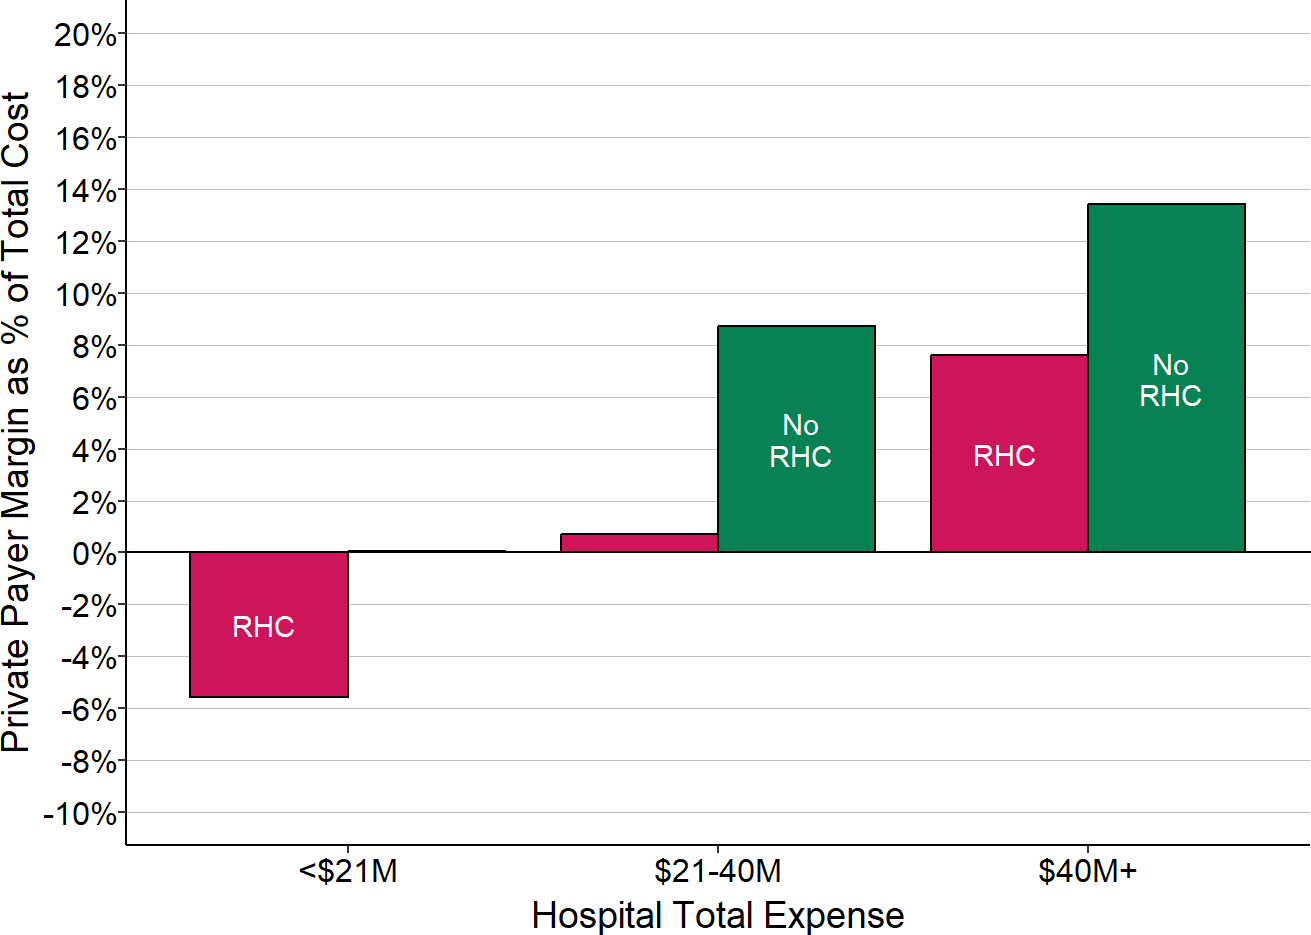
The value for each hospital is the median during the most recent three years available (excluding 2020) of the margin earned on services for patients with private insurance divided by the hospital’s total expenses; this represents the amount that privately-insured patients contributed to the hospital’s total margin. The chart shows the median of these amounts for all of the rural hospitals with total expenses in each category based on whether the hospital operated a Rural Health Clinic (RHC) or not.
Figure 15
Private Payer Contribution
to Total Hospital Margin
By Whether Surgery is Performed
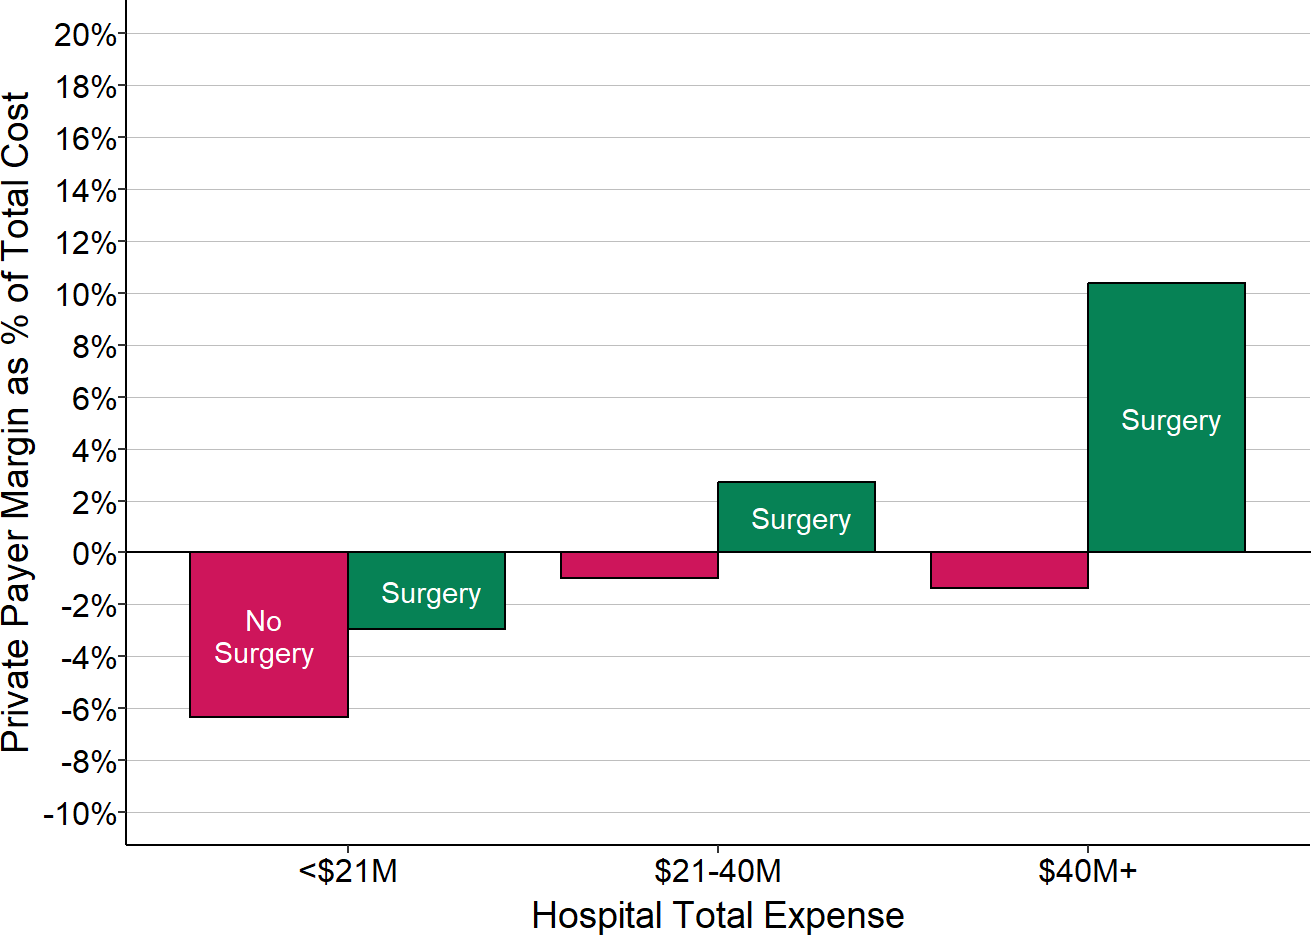
The value for each hospital is the median during the most recent three years available (excluding 2020) of the margin earned on services for patients with private insurance divided by the hospital’s total expenses; this represents the amount that privately-insured patients contributed to the hospital’s total margin. The chart shows the median of these amounts for all of the rural hospitals with total expenses in each category based on whether the hospital performed surgery or not.
Whereas primary care is one of the lowest-paid services in healthcare, surgery is one of the highest paid procedures. The cost report data show that small rural hospitals that were able to perform surgery had smaller losses or higher profits on patients with private insurance than hospitals that did not.
Although the majority of small rural hospitals perform at least some surgical procedures, one-third of the smallest hospitals (those with less than $24 million in total expenses) do not, and these hospitals have bigger financial losses than those that do offer surgery.
Impact of Patient Bad Debt
For services delivered to patients with private insurance, the insurance company determines the total amount the hospital is eligible to be paid (what is commonly referred to as the “allowed amount”), but the insurance company rarely pays that full amount itself. Patients are generally required to pay all or part of the allowed amount based on the cost-sharing requirements in their insurance – i.e., deductibles, copayments, and co-insurance. The private insurance payments shown in the previous section represent the allowed amounts determined by the health insurance plan, including both the portion paid directly by the health plan and the portion patients are expected to pay.
Cost-sharing requirements in private insurance plans have increased significantly over time, and a growing number of patients cannot afford to pay them. As a result, hospitals receive less actual revenue for privately-insured patients than their insurance company has “allowed” the hospital to receive. If a patient with private insurance does not pay all or part of the portion of charges for which they are responsible, this is classified on hospital cost reports as either “charity care for insured patients” (for patients who meet the hospital’s charity care standards) or as “bad debt” (for the remaining patients who do not qualify for charity care). Patients who do not have insurance but who do not qualify for charity care (typically described as “self-pay” patients) are responsible for the hospital’s full charge for their services or any discounted amount the hospital offers them; any portion of this amount that they fail to pay is also classified as bad debt.31 (Patients who do not have insurance and who meet the hospital’s standards for charity care are shown as “charity” in the earlier figures.)
The cost of services associated with these unpaid charges represents a significant loss for most hospitals and it is shown as “Bad Debt” in the figures.32 For most hospitals, the cost associated with bad debt33 is much larger than the cost of charity care for insured patients.34
As shown in Figure 9, bad debt for private-pay patients represents more than 2% of the total cost of services at small rural hospitals, i.e., it causes total margins at most rural hospitals to be more than 2% lower than what they would otherwise be. Bad debt losses are somewhat larger at the smallest rural hospitals than at larger hospitals, which is likely due to a combination of lower incomes in small rural communities and higher cost-sharing requirements in the health insurance plans available in these communities. Out-of-pocket medical costs for people with employer-sponsored insurance are significantly higher than average in a number of states that have large rural populations. In many of these states, more than one-fifth of the people with employer-sponsored insurance had out-of-pocket medical expenses greater than 10% of their household income.35
Impact of Medicaid on Hospital Finances
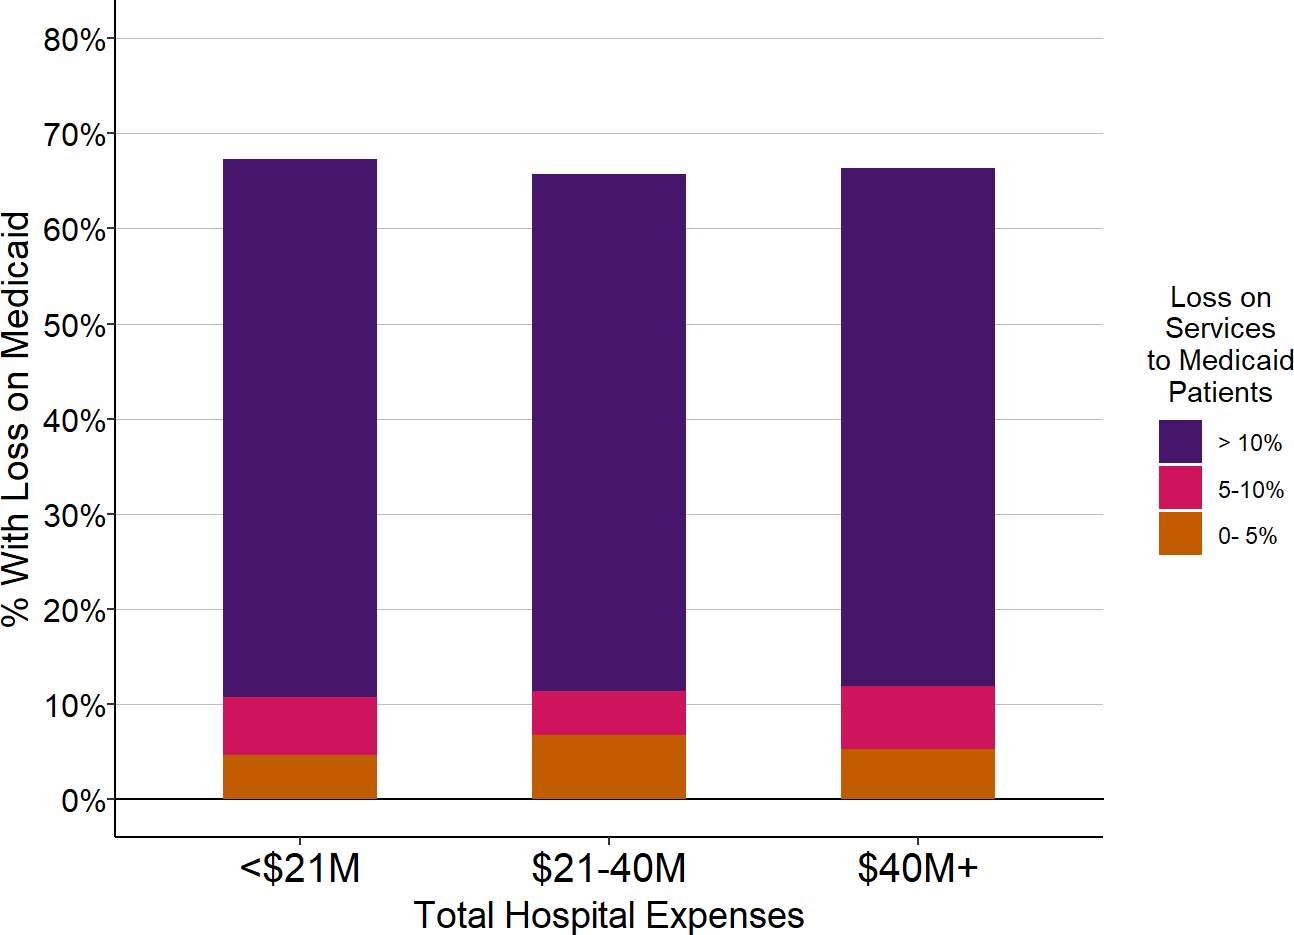
The majority of small rural hospitals, regardless of the hospital’s size, lose money on Medicaid patients. Moreover, the majority of hospitals have large losses – greater than 10% – on Medicaid patients.
Figure 16
Percentage of Rural Hospitals
With Losses on Medicaid Patients
| Total Hospital Expenses | Number of Hospitals |
Percent with Loss on Medicaid Patients |
Percent with Medicaid Loss 5-10% |
Percent with Medicaid Loss > 10% |
|---|---|---|---|---|
| <$24M | 532 | 58.8% | 51.3% | 46.2% |
| $24-45M | 515 | 58.8% | 54.8% | 49.7% |
| $45M+ | 996 | 60.0% | 53.5% | 47.2% |
The chart shows the percentage of rural hospitals in each size category that lost money on services to patients insured by Medicaid during the most recent three years available (excluding 2020). The purple bars represent the proportion of hospitals that lost 10% or more on services to Medicaid patients, and the red bars represent the proportion that lost 5-10% on services to patients insured by Medicaid.
On average, rural hospitals are paid less for services by Medicaid than by private payers. The smallest rural hospitals lose money on both Medicaid and private-pay patients, but the losses are larger on Medicaid patients.
Figure 17
Margins on Medicaid vs. Private Payers at Rural Hospitals
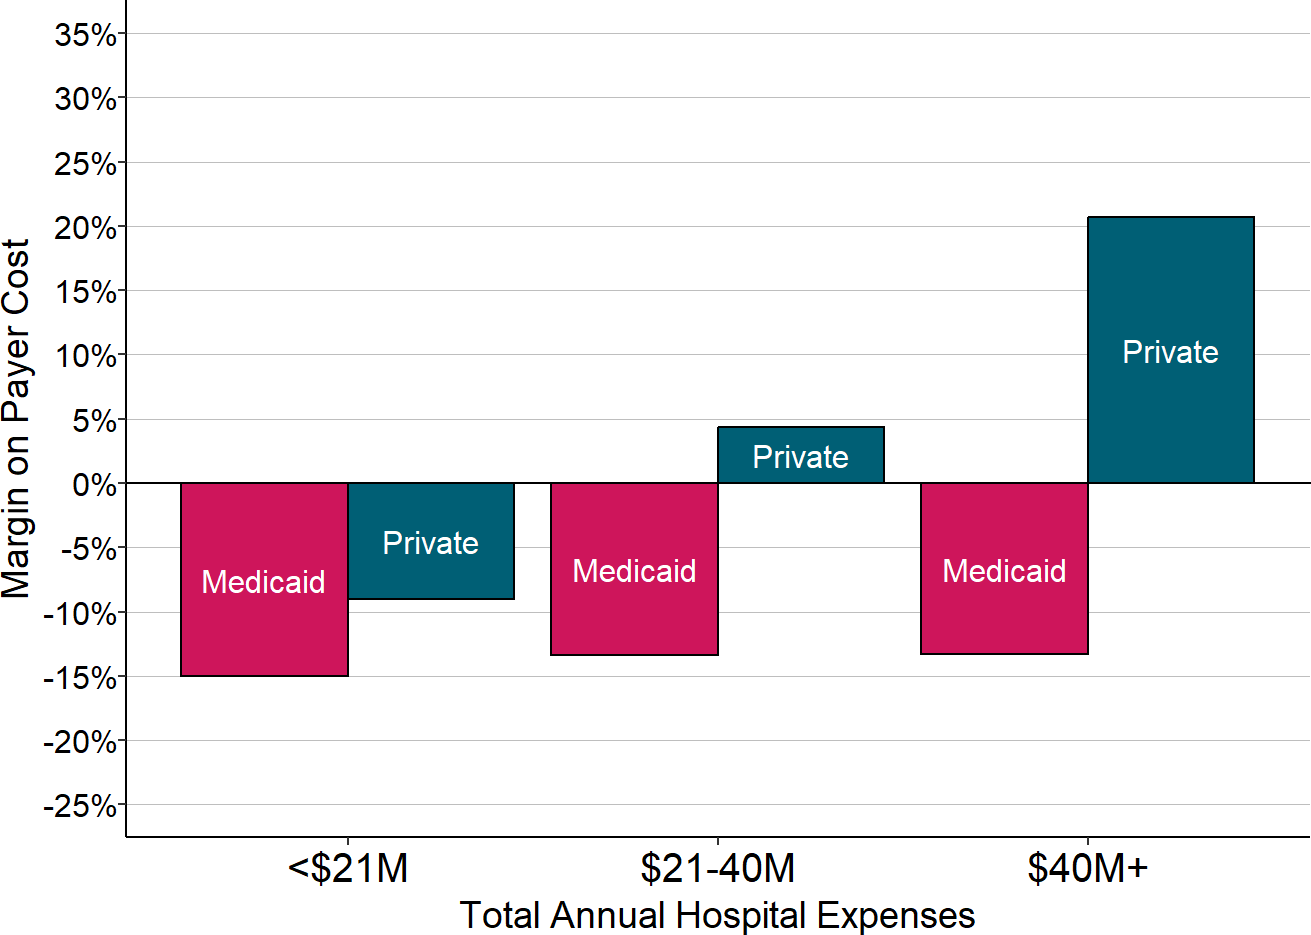
Each bar represents the median value for all rural hospitals that had total expenses in the category shown. The value for each hospital is the median during the most recent three years available (excluding 2020) of the margin (profit or loss) earned on services delivered to patients with private insurance or patients with Medicaid.
However, as shown earlier in Figure 4, a much smaller portion of hospitals’ services are delivered to Medicaid patients than to private-pay patients. This means that a loss on services to patients with private insurance will have a bigger impact on the hospital’s overall margin than a similar loss on Medicaid patients. The amount that a particular type of payer contributes to a hospital’s total profit or loss is determined by two separate factors: (1) the difference between what the payer pays for each service and how much it costs the hospital to deliver the service, and (2) what proportion of the hospital’s total patients and services are paid for by that payer. A small profit or loss for a large number of patients can have a bigger impact on the hospital’s overall profitability than a larger profit or loss for a small group of patients.
Figure 18
Contributions of Medicaid and Private Payers
to Total Margins at Rural Hospitals
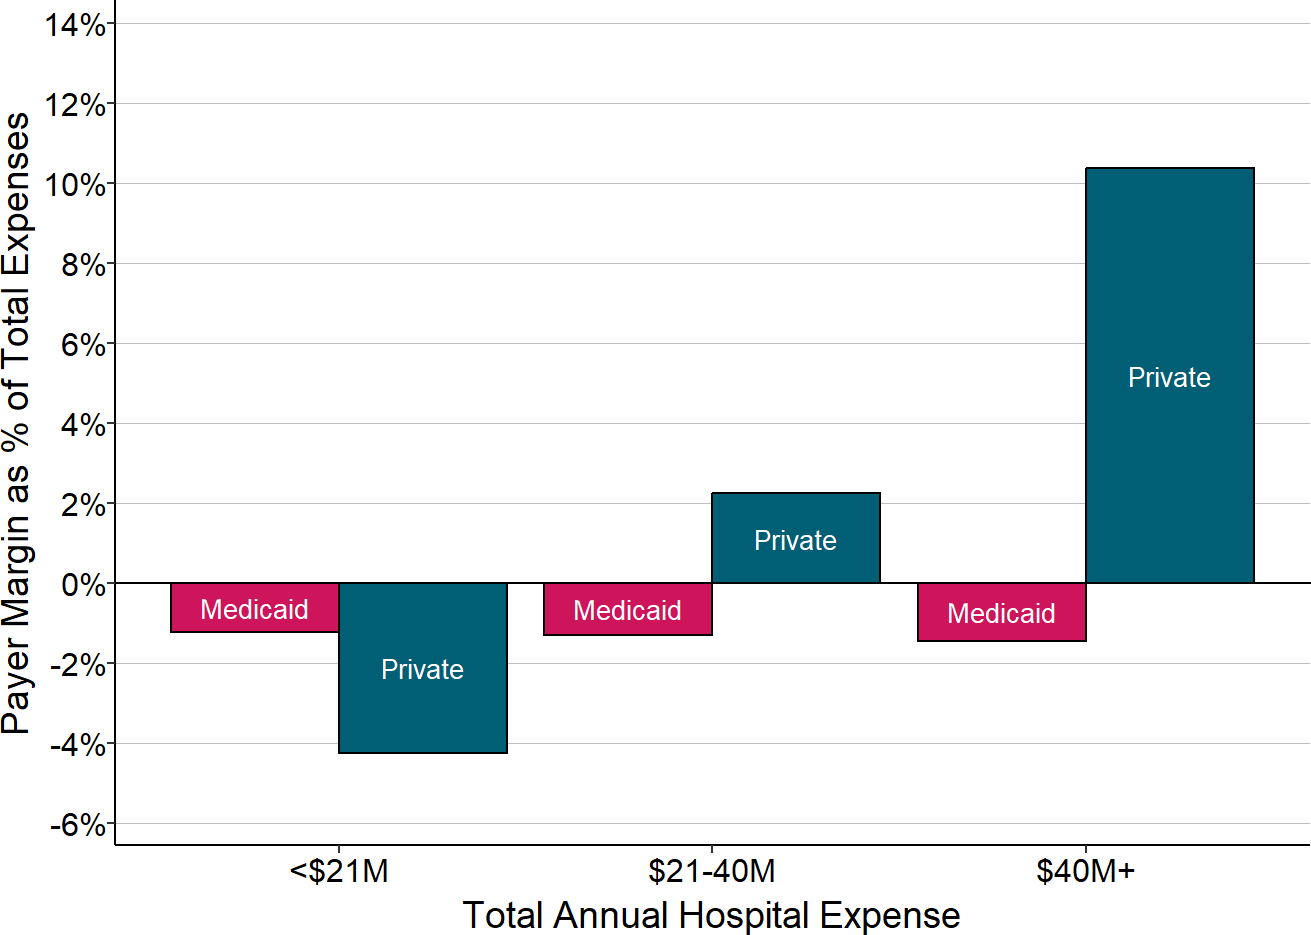
Each bar represents the median value for all rural hospitals that had total expenses in the category shown. The value for each hospital is the median during the three most recent years available of the dollar margin (i.e., profit or loss) earned on services for patients with private insurance or patients with Medicaid, divided by the hospital’s total expenses. This represents the amount that privately-insured patients or Medicaid patients contributed to the hospital’s total margin.
In fact, as shown in Figure 18, at the smallest rural hospitals, the losses on patients with private insurance have a bigger negative impact on the hospital’s overall margin than the losses on patients with Medicaid.36 In contrast, at the larger hospitals, the profits on the private-pay patients more than offset the large losses on Medicaid patients because there are many more private-pay patients than Medicaid patients.37
The Impact of Medicare Payments
In contrast to private payers and Medicaid, Original Medicare (i.e., traditional Medicare insurance, not a Medicare Advantage plan) provides better financial support to small rural hospitals than it does to larger hospitals. The majority of very small rural hospitals receive payments for Original Medicare beneficiaries that are slightly higher than the costs of services to those beneficiaries, whereas at larger hospitals, most hospitals lose money on Original Medicare patients.
Figure 19
% of Small Rural Hospitals
With Losses on Original Medicare Patients
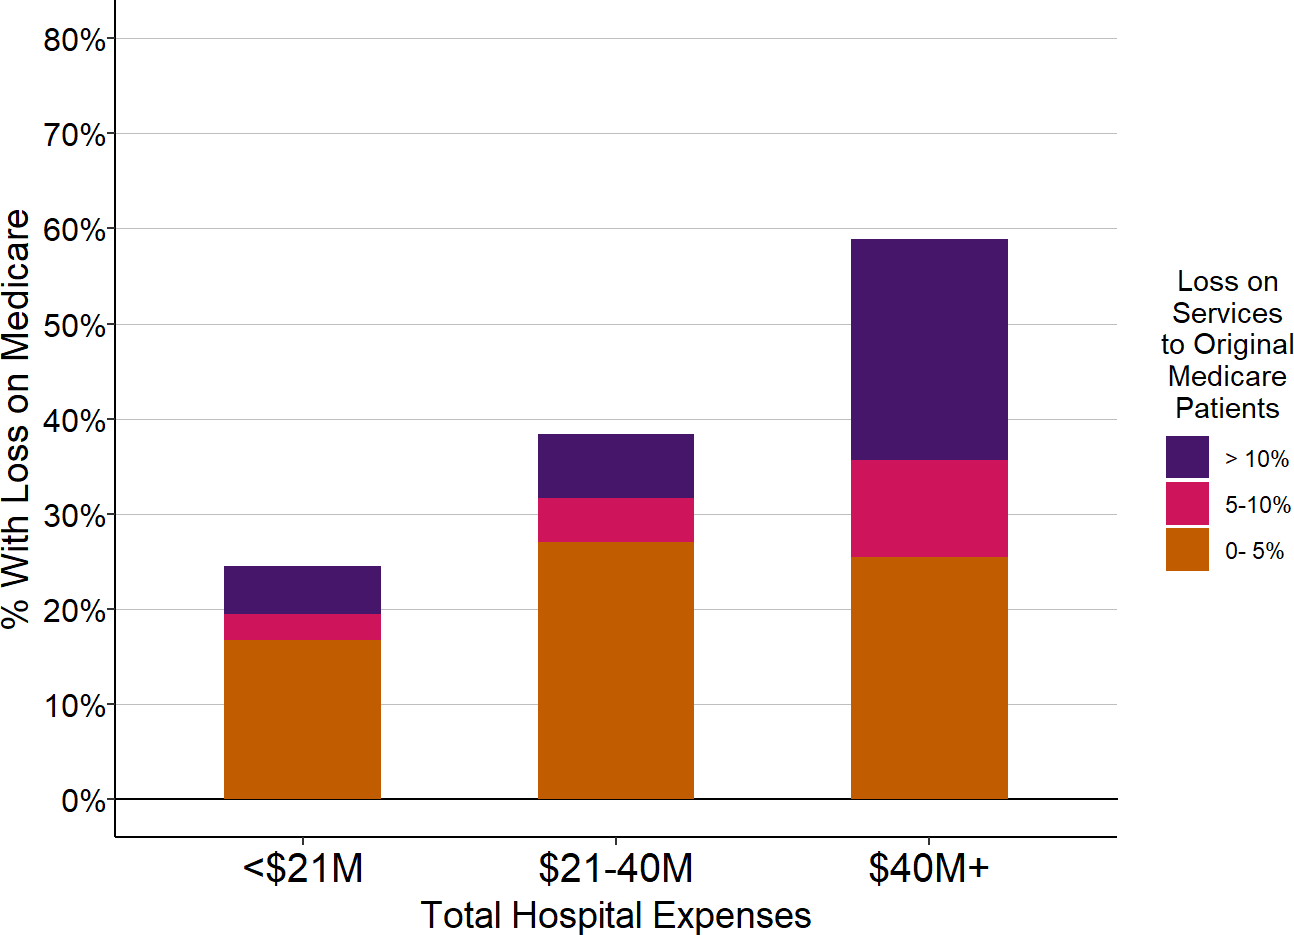
| Total Hospital Expenses | Number of Hospitals |
Percent with Loss on Original Medicare |
Percent with Medicare Loss 5-10% |
Percent with Medicare Loss > 10% |
|---|---|---|---|---|
| <$24M | 532 | 30.6% | 9.2% | 4.7% |
| $24-45M | 515 | 47.4% | 15.3% | 9.5% |
| $45M+ | 996 | 67.2% | 37.2% | 25.2% |
The chart shows the percentage of rural hospitals in each size category that lost money on services to patients with Original Medicare insurance during the three most recent years available. The purple bars represent the proportion of hospitals that lost 10% or more on services to Original Medicare beneficiaries, and the red bars represent the proportion that lost 5-10% on services to patients insured by Original Medicare.
Although patients with Original Medicare represent a much larger percentage of rural hospitals’ patients than patients with Medicaid do, there are generally fewer Medicare patients than there are privately-insured patients at most hospitals. Moreover, the losses on patients with Original Medicare are much smaller than the losses on Medicaid patients or private-pay patients. As a result, the losses on privately-insured patients at the smallest rural hospitals have a much bigger impact on the hospitals’ total margins than do profits or losses on Medicare patients. In contrast, the positive margins on private-pay patients at many larger hospitals more than offset their losses on Medicare patients as well as the losses on Medicaid patients.
Figure 20
Contributions of Original Medicare and Private Payers
to the Total Margin at Rural Hospitals
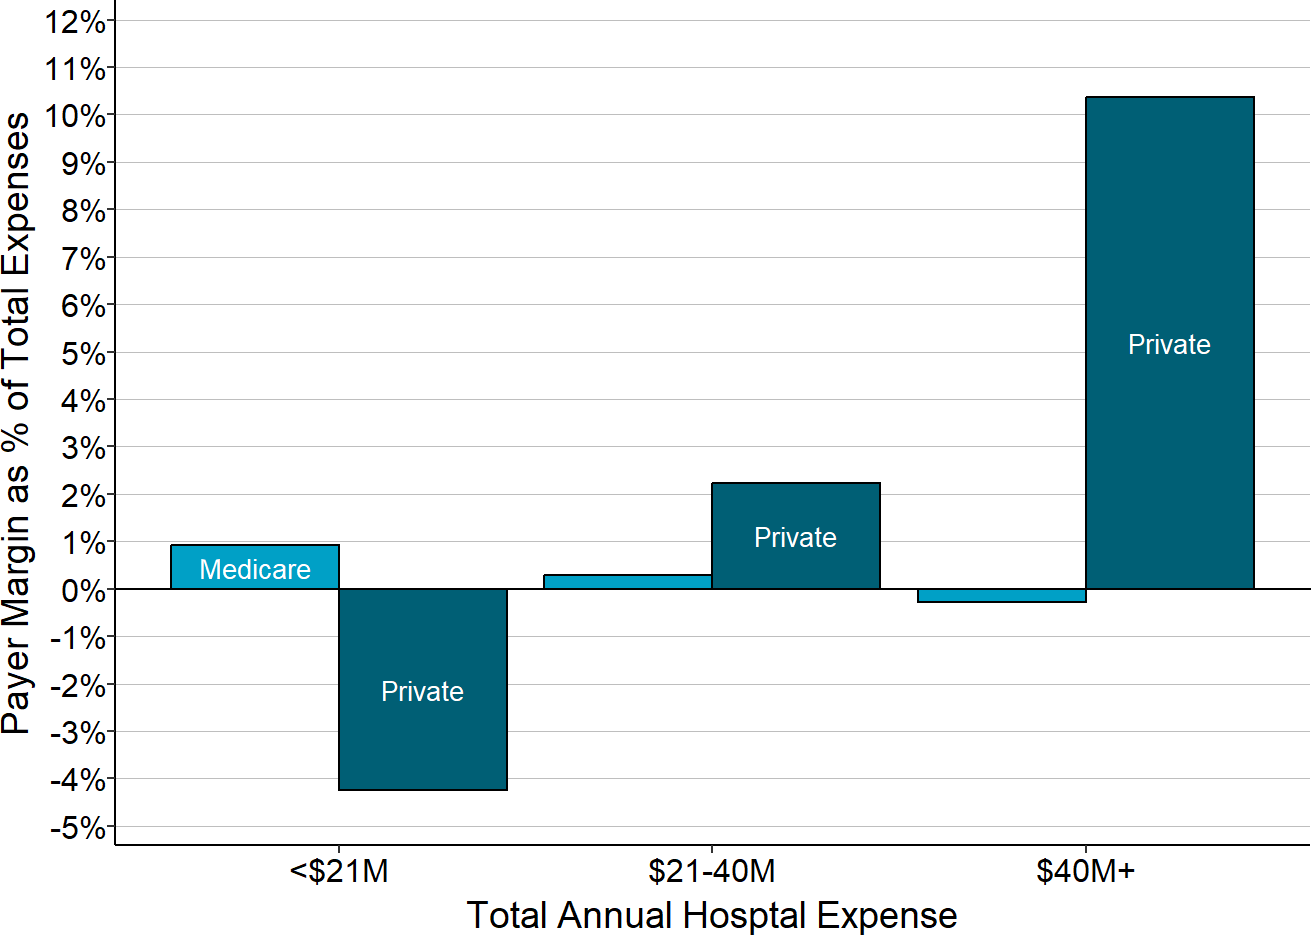
Each bar represents the median value for all rural hospitals that had total expenses in the category shown. The value for each hospital is the median during the three most recent years available of the dollar margin (i.e., profit or loss) earned on services for patients with private insurance or patients with Original Medicare, divided by the hospital’s total expenses. This represents the amount that privately-insured patients or Original Medicare patients contributed to the hospital’s total margin.
Payments for the smallest hospitals under Original Medicare are higher because smaller hospitals are more likely to be classified as Critical Access Hospitals and qualify for cost-based payment.38 Except for Critical Access Hospitals, the majority of rural hospitals lose money on Medicare patients. The strengths and weaknesses of the Critical Access Hospital payment system is discussed in more detail in the section on Cost-Based Payment.
Figure 21
Medicare Contribution to Total Hospital Margin
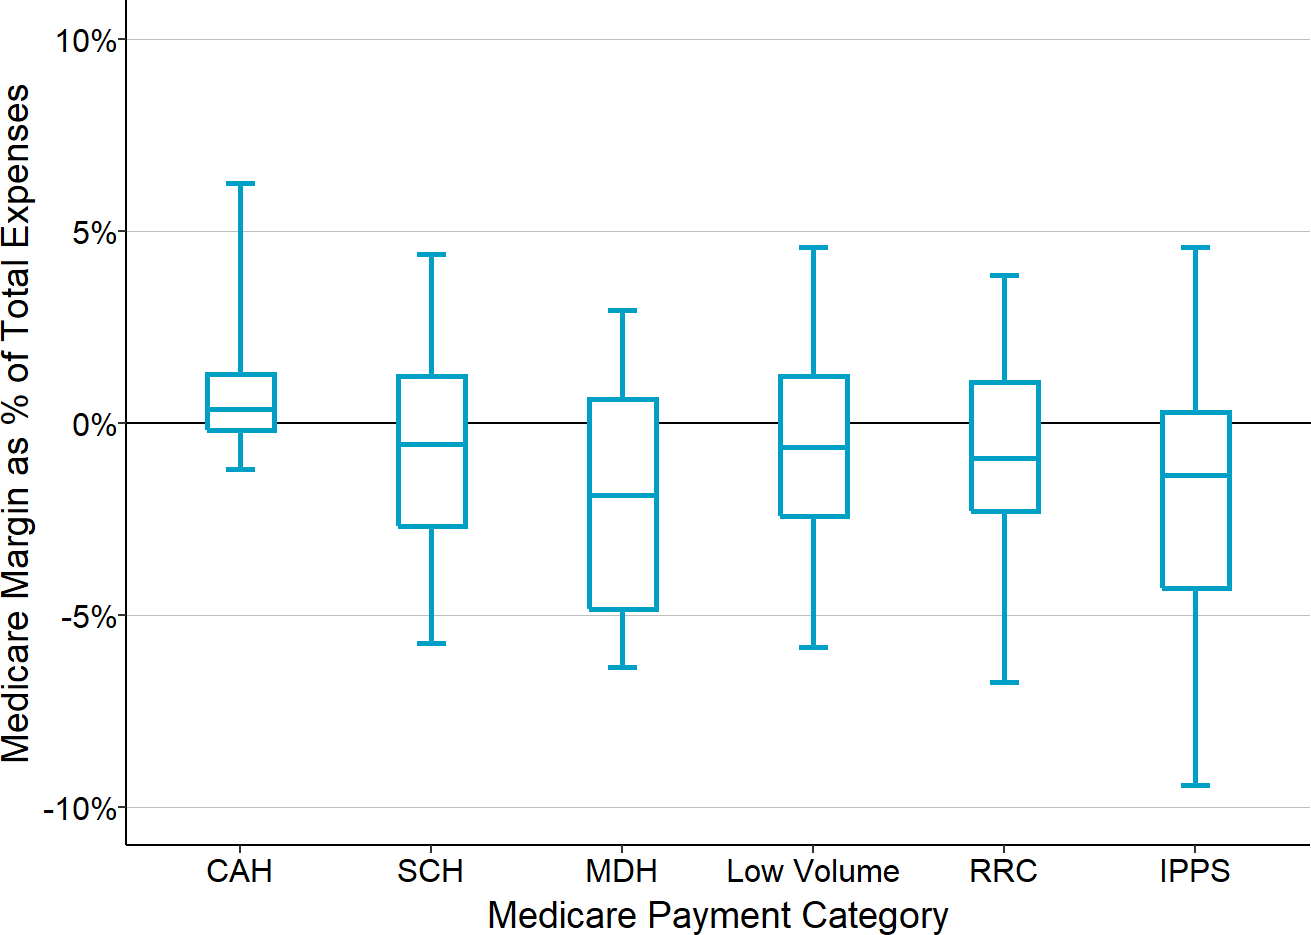
The chart shows the amounts Original Medicare contributes to the hospital’s total margin for rural hospitals in each Medicare payment category. The value for each hospital is the median for the three most recent years available of the margins on Original Medicare patients divided by the hospital’s total expenses. CAH = Critical Access Hospital, SCH = Sole Community Hospital, MDH = Medicare Dependent Hospital, Low Volume = Eligible for Low Volume Adjustment in Payment, RCH = Participant in Rural Community Hospital Demonstration, IPPS = Standard Inpatient Prospective Payment System Payment.
The bottom of each box shows the 1st quartile (i.e., 25% of the hospitals have a value lower than this amount), the top of the box shows the 3rd quartile, and the center line represents the median value for the category (i.e., 50% of the hospitals are above or below this amount). The ends of the “whiskers” above and below each box represent the 5th and 95th percentiles, i.e., the values for 90% of the hospitals in the category are between these amounts. The center line is below 0 for all categories other than Critical Access Hospitals (CAHs), which means the majority of other rural hospitals lose money on their Medicare patients.
The Key Role of Other Sources of Revenue
As a result of the large losses on patients with private insurance, over 70% of the smallest rural hospitals (those with total expenses below $24 million) have been losing money overall on the delivery of patient services in recent years. The majority have had losses of 6% or more, and over one-fourth have had losses of 15% or more. Most rural hospitals with expenses between $24 million and $45 million have also been losing money on patient services, and over 10% have had losses greater than 15%.
In contrast, two-thirds of rural hospitals with expenses greater than $45 million have been making profits delivering patient services.
If a hospital is losing significant amounts of money on patient services, the only way it can continue to operate is if it has sources of revenue other than payments for patient services. Most of the smallest rural hospitals receive a significant amount of other revenues that offset the losses they incur on patient services, whereas the majority of the largest rural hospitals do not need other sources of revenue in order to be profitable.
Figure 22
Contributions of Patient Services Revenue and
Other Revenues to Total Hospital Margins
at Rural Hospitals
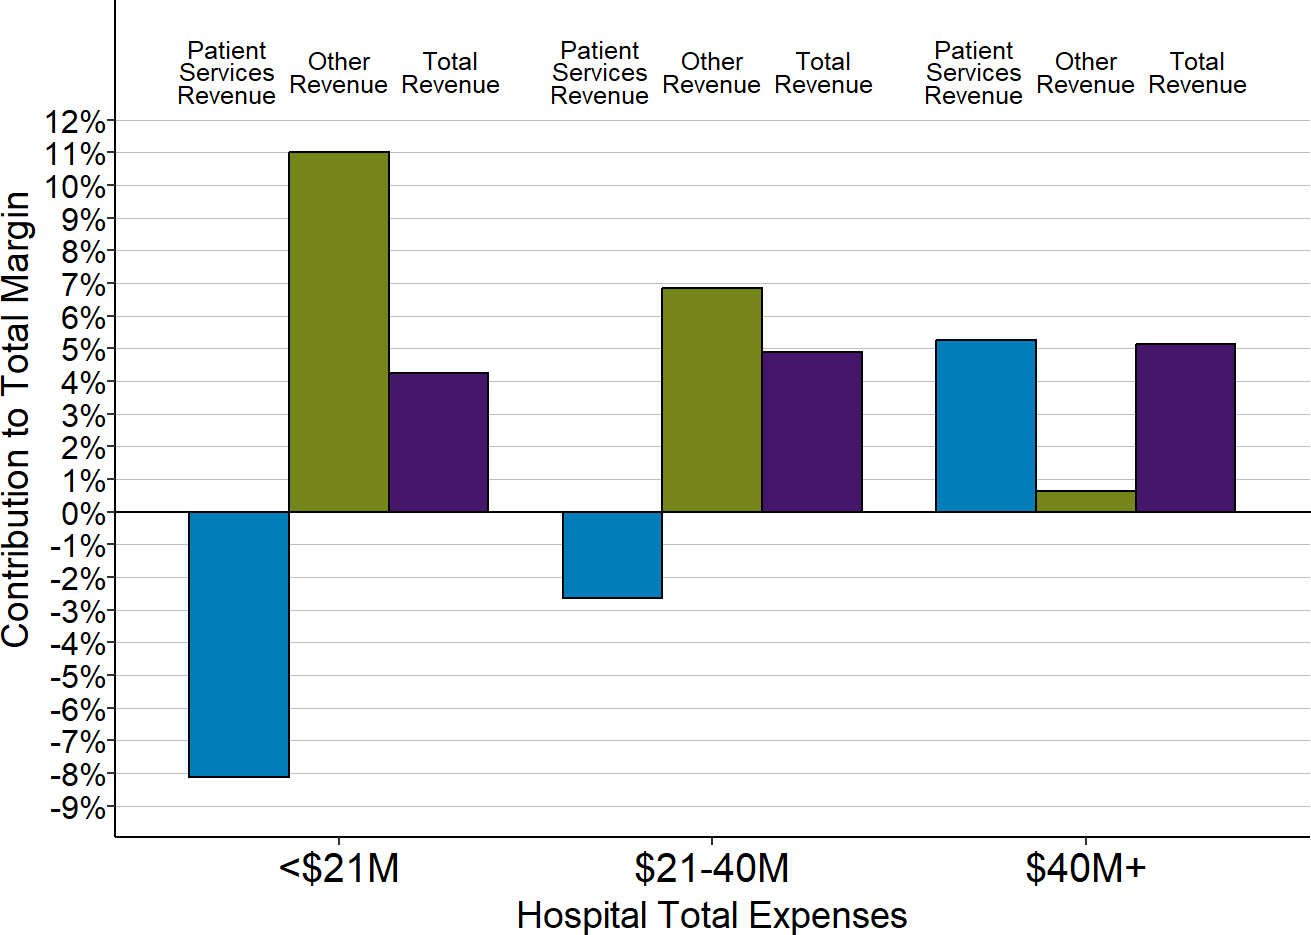
Each bar represents the median value for all rural hospitals that had total expenses in the category shown. The value for each hospital is the median during the most recent three years (except for 2020) of (a) the dollar margin (i.e., profit or loss) earned on services to patients, (b) the amount of revenue received from sources other than patient serivces, or (c) the total hospital revenue, divided by the hospital’s total expenses. This shows how much revenue from patient services and other sources of revenue contributed to the hospital’s total margin.
Of course, if the losses on patient services are too large or the other sources of revenue are too small, a small rural hospital will end up with overall losses and it could be forced to close as a result. The small rural hospitals that have closed since 2015 had losses on patient services that were much higher than what other small rural hospitals experienced, and they received less in other revenues as a percentage of their total expenses that could help offset these losses. As a result, they incurred significant overall losses, which likely led to their closure.
Figure 23
Contributions of Patient Services and Other Revenues
to Total Margins at Closed and Open Small Rural Hospitals
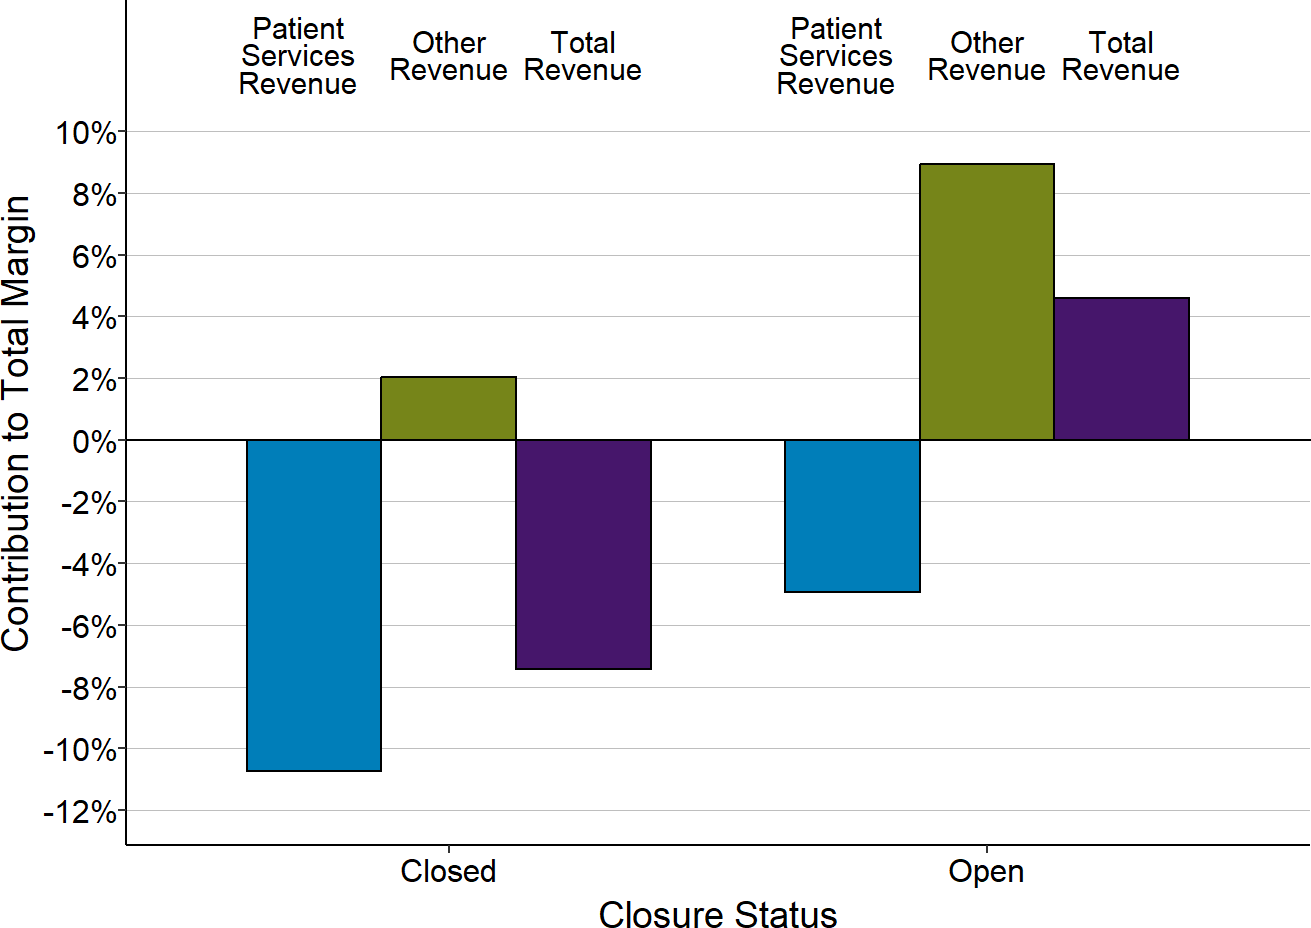
Each bar represents the median value for (1) all rural hospitals that have closed since 2015 or (2) remained open in 2024. Only rural hospitals with less than $45 million in expenses are included. The value for each hospital is the median for the three years prior to closure (for hospitals that had closed) or the most recent year available (for hospitals that were open in 2024) of (a) the dollar margin (i.e., profit or loss) earned on services to patients, (b) the amount of revenue received from sources other than patient serivces, or (c) the total hospital revenue, divided by the hospital’s total expenses. This shows how much revenue from patient services and other sources of revenue contributed to the hospital’s total margin.
Rural hospitals vary significantly in their ability to obtain “other revenues” to offset losses on patient services. Hospitals that are organized as public hospital districts or owned by a governmental entity (e.g., a county or municipality) often have access to public funding sources that are not available to other hospitals, such as the ability to impose tax levies on local residents. The more than 200 small rural hospitals operated by hospital districts have significantly higher losses on patient services than other similarly-sized hospitals, but they also have more revenue from taxes and other sources that has enabled a majority to balance their budgets and continue operating.
Figure 24
Contributions of Patient Services and Other Revenues
to Total Margins by Hospital Ownership Status
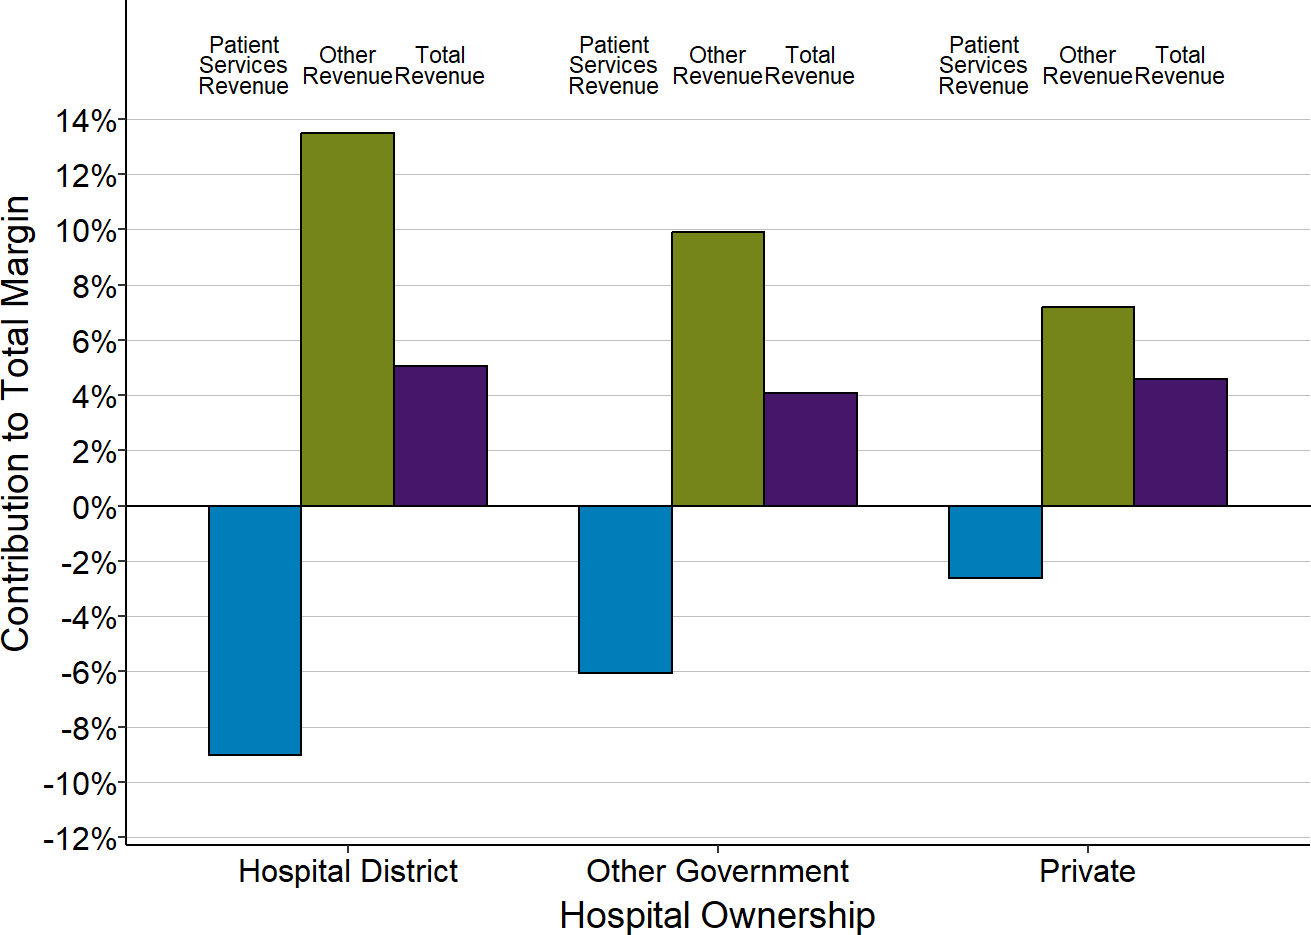
Each bar represents the median value for small rural hospitals with the type of ownership shown. Only rural hospitals with less than $45 million in expenses are included. The value for each hospital is the median during the three most recent years available of (a) the dollar margin (i.e., profit or loss) earned on services to patients, (b) the amount of revenue received from sources other than patient serivces, or (c) the total hospital revenue, divided by the hospital’s total expenses. This shows how much revenue from patient services and other sources of revenue contributed to the hospital’s total margin.
The Impact of the Pandemic on Small Rural Hospitals
The nationwide coronavirus pandemic had a number of significant impacts on small rural hospitals. Patient service margins at most hospitals decreased during the pandemic, but large amounts of special federal assistance caused total margins to temporarily improve.
Pandemic Impact on Patient Services
The First Year of the Pandemic (2020)
Most rural hospitals experienced lower margins on patient services during their 2020 fiscal year than during the previous year.39 This was most problematic for small rural hospitals (those with less than $45 million in total annual expenses). The majority of small rural hospitals were losing money on patient services prior to the pandemic, so the lower margins during the initial year of the pandemic pushed them even further into the red. In contrast, even though larger rural hospitals and urban hospitals also experienced lower margins, most of them continued to generate profits on patient services overall.
Figure 25
Change in Median Margins on Patient Services
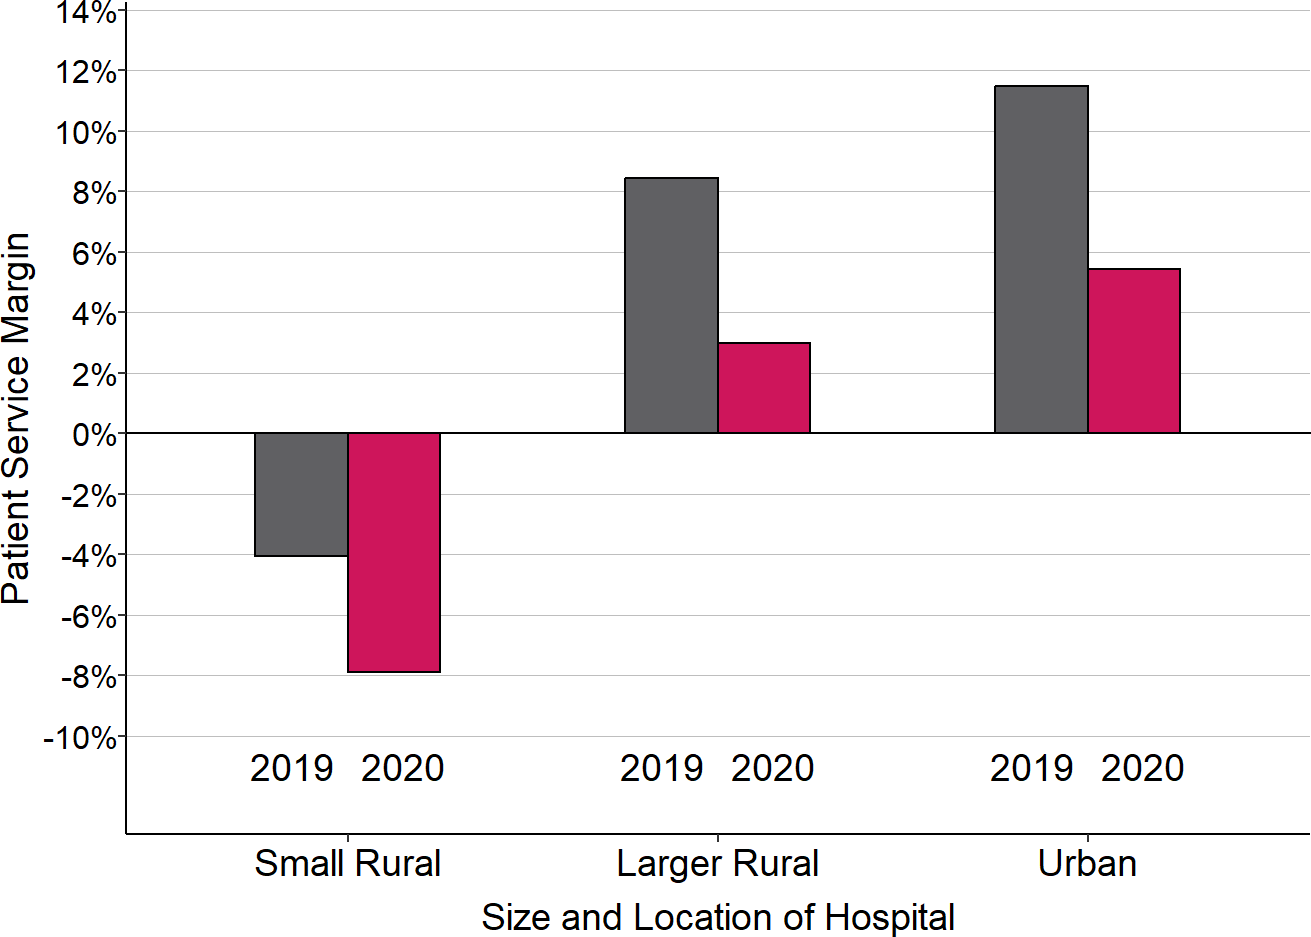
“Small Rural” hospitals are rural hospitals with less than $45 million in total annual expenses. 2020 is the hospital’s fiscal year that included the March-June 2020 period, and 2019 is the preceding year.
The reductions in margins on patient services during the initial months of the pandemic were due to three different factors:
Higher Costs of Delivering Services. The costs of delivering patient services increased due to the high costs of acquiring personal protective equipment and other COVID-related expenses on top of the normal annual growth in the costs of supplies and personnel. Patient service costs increased by a median of 3.5% at small rural hospitals in 2020, but the increase was over 8% for one-fourth of the hospitals.
Fewer Services Delivered. At most rural hospitals, the volume of patient services decreased. This was caused by a combination of patients delaying care and reduced ability of hospitals to deliver services due to pandemic restrictions and shortages of staff and supplies. Total charges for services delivered (the best measure of overall service volume available) decreased by a median of 2% at small rural hospitals, which suggests that the number of services at most of the hospitals decreased by 2% or more.40 For one-fourth of small rural hospitals, charges decreased by more than 8%.
Inadequate Payments for Services by Private Payers. Private health insurance plans paid a smaller percentage of rural hospitals’ charges and costs during the initial year of the pandemic. In contrast, Medicare payments to rural hospitals increased during the pandemic because of the suspension of federal sequestration reductions during the portion of the year in which the Public Health Emergency was in effect. Also, since Medicare pays Critical Access Hospitals based on their actual costs, they received an additional increase in Medicare payments if they experienced an increase in costs. The majority of rural hospitals also received higher Medicaid payments as a percentage of their charges during the initial year of the pandemic, although this varied significantly by state and by hospital.
Figure 26
Change in Percentage of Charges Paid, 2019-2020
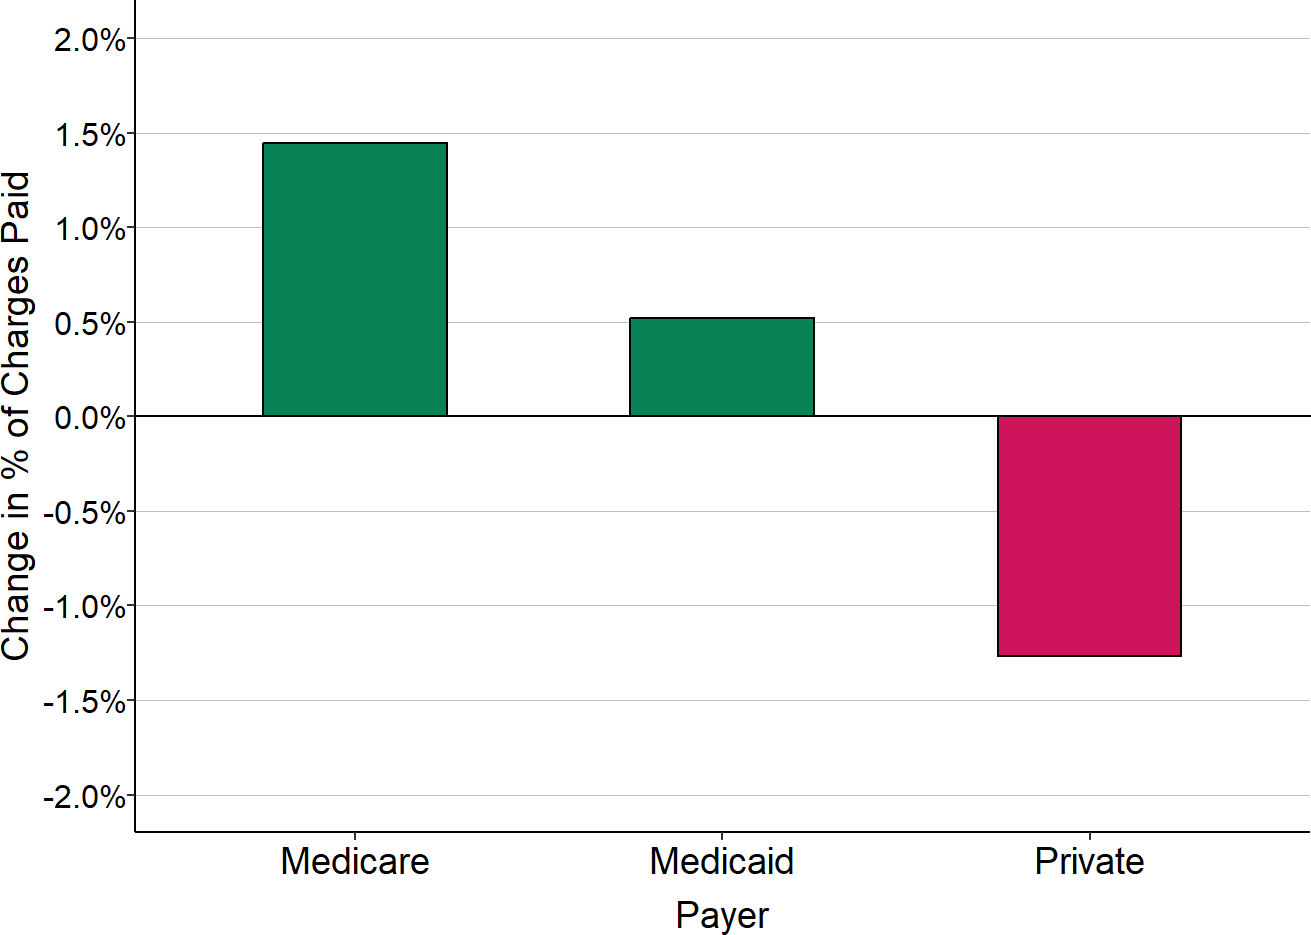
“Medicare” includes only Original Medicare. Medicare Advantage plans are included with “Private” payers. The change shown is the difference between the fiscal year that included the March-June 2020 period and the preceding fiscal year for all rural hospitals.
The primary reason overall patient service margins at rural hospitals decreased during the pandemic was higher losses on patients insured by private health plans (including Medicare Advantage plans). The losses on patients insured by private health plans hurt the smallest rural hospitals the most because they were already receiving low payments from private payers prior to the pandemic. Although hospitals of all sizes experienced lower margins on patients with insurance from private companies during the pandemic, for most small rural hospitals, the reductions meant they lost money providing services to these patients.
Figure 27
Median Margin on Patients With Private Insurance
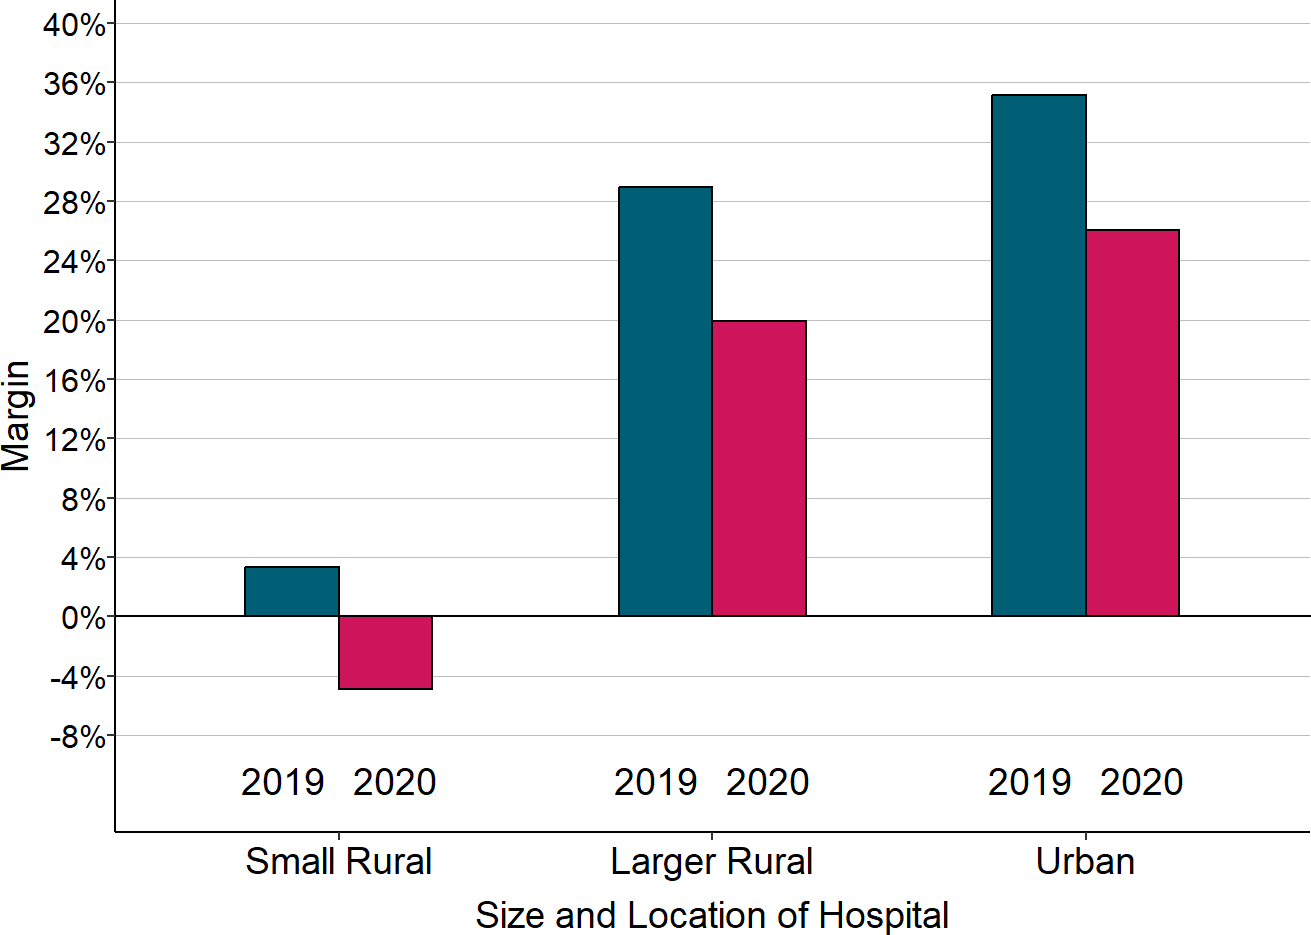
“Small Rural” hospitals are rural hospitals with less than $45 million in total annual expenses. 2020 is the hospital’s fiscal year that included the March-June 2020 period, and 2019 is the preceding year. The margin shown is the difference between the revenues received from private insurance plans (including Medicare Advantage plans) and the cost of the services delivered to the patients insured by those plans, divided by the cost.
The Second Year of the Pandemic (2021)
In the second year after the pandemic began, total charges at the majority of hospitals increased above pre-pandemic levels, reflecting a combination of a higher volume of services and higher amounts charged per service to cover higher costs. However, costs increased significantly compared to pre-pandemic levels, and at most small rural hospitals, revenues increased less than the increase in costs. As a result, patient service margins at small rural hospitals remained lower than they were prior to the pandemic.
Payments from private payers continued to be the primary cause of the reduction in margins for small rural hospitals. The reductions were much higher in some states than others, reflecting both differences in payments by different insurance plans and differences in the payers providing insurance in each state.
Figure 28
Change in Median Margins on Patient Services
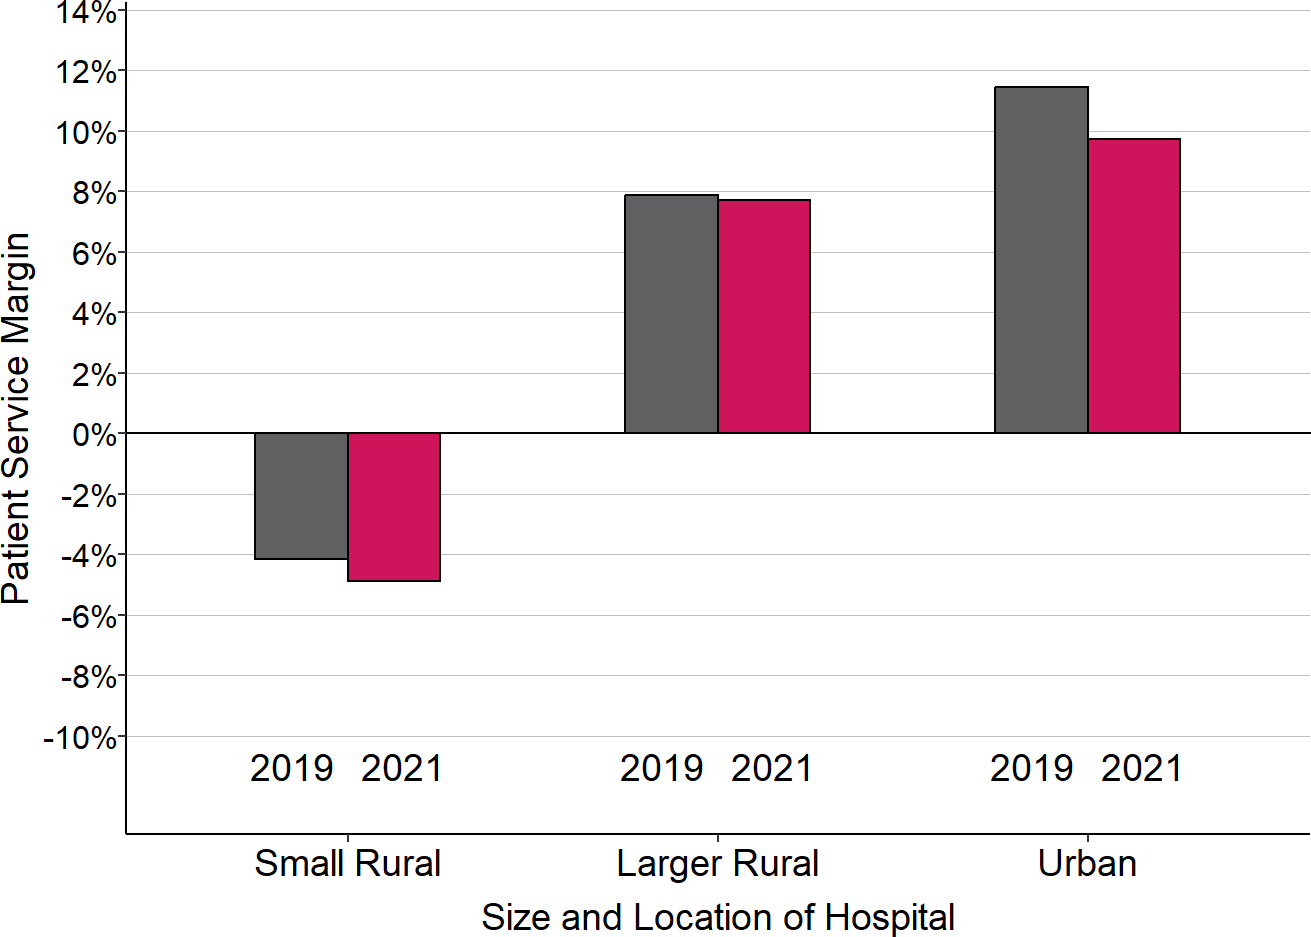
“Small Rural” hospitals are rural hospitals with less than $45 million in total annual expenses. The hospital’s fiscal year that included the March-June 2020 period is considered to be 2020 for the purposes of this analysis. 2021 is the hospital’s fiscal year that followed that, and 2019 is the year that preceded it.
Figure 29
Median Margin on Patients With Private Insurance
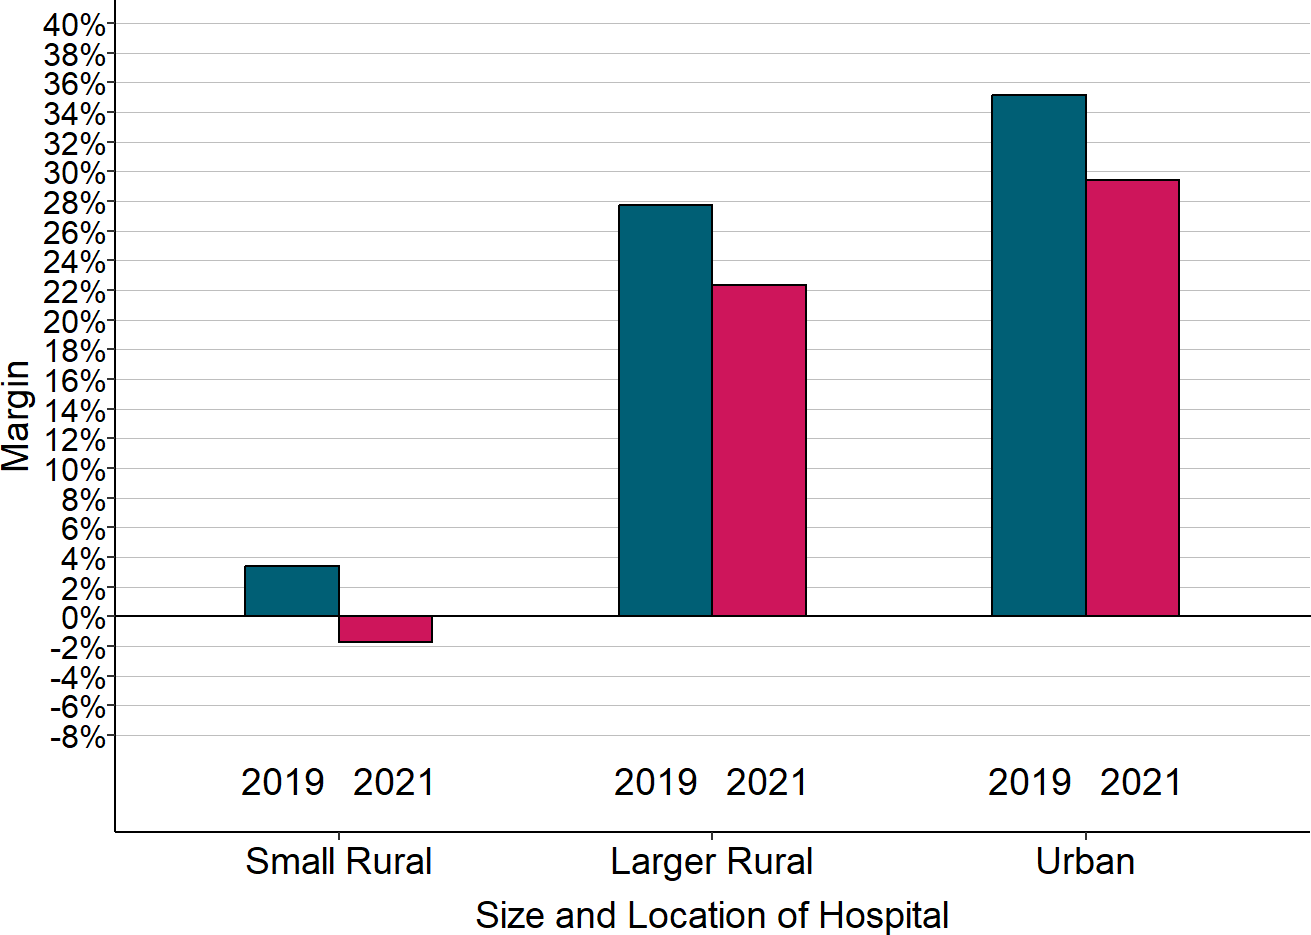
“Small Rural” hospitals are rural hospitals with less than $45 million in total annual expenses. 2020 is the hospital’s fiscal year that included the March-June 2020 period, and 2019 is the preceding year. The margin shown is the difference between the revenues received from private insurance plans (including Medicare Advantage plans) and the cost of the services delivered to the patients insured by those plans, divided by the cost.
The Third Year of the Pandemic (2022)
Inflation and supply chain problems made everything more expensive in 2022 than 2021, and the national staff shortages in healthcare forced rural hospitals to pay much higher amounts to hire and retain staff and to pay high rates for temporary workers to fill vacancies. On top of higher costs, the 2% sequestration reduction in Medicare payments resumed in the second half of 2022. Both of these factors pushed hospitals’ margins on patient services lower in 2022.
Pandemic Impact on Total Profit Margins
One might have expected that the higher losses on patient services in 2020 would have caused more rural hospitals to close in 2021. That didn’t happen because rural hospitals’ total margins improved. In fact, the largest improvements occurred at the smallest rural hospitals, despite the greater losses on patient services.
Figure 30
Change in Median Total Margin 2019-2020
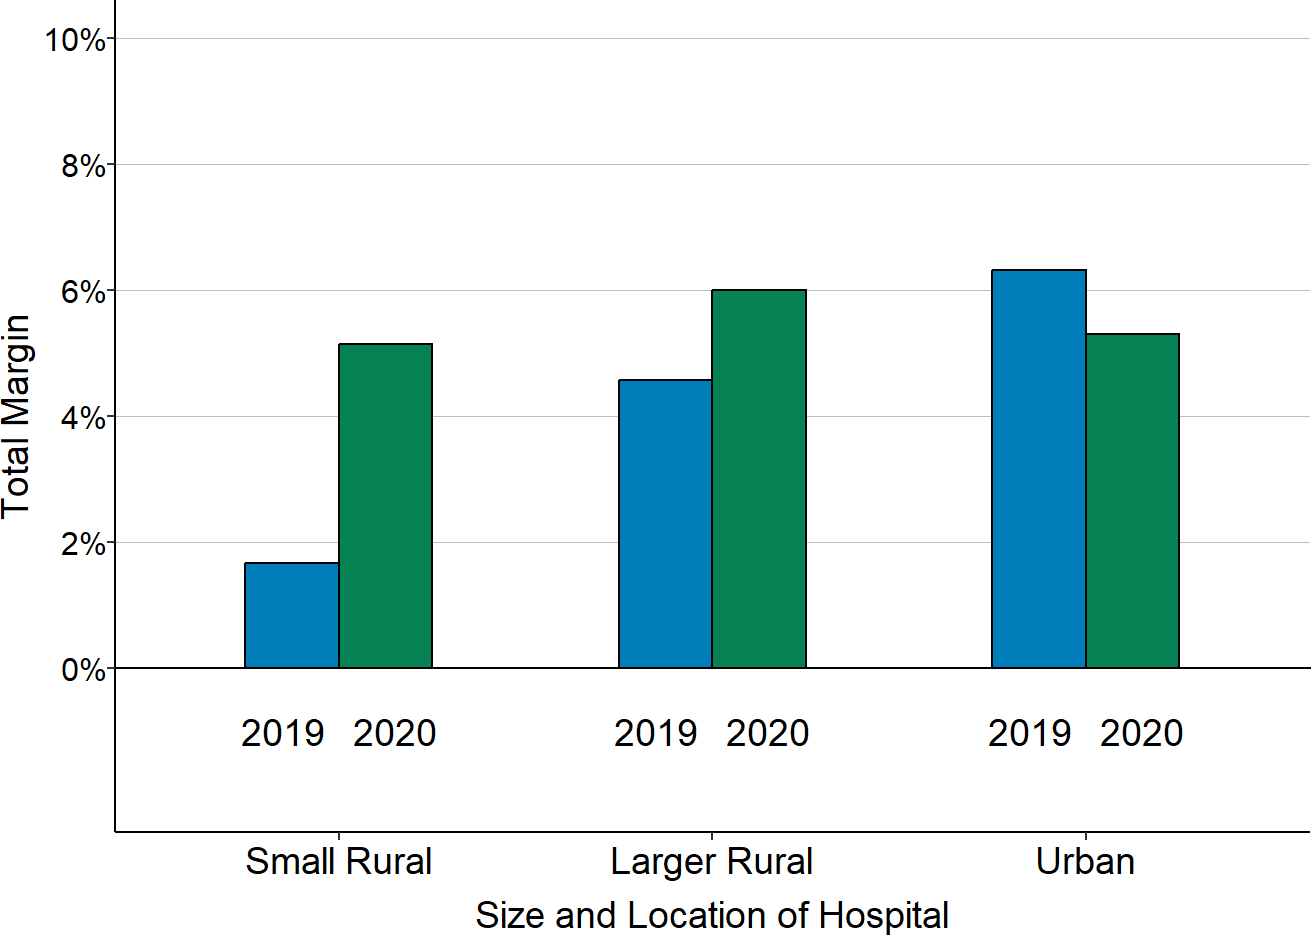
“Small Rural” hospitals are rural hospitals with less than $45 million in total annual expenses. 2020 is the hospital’s fiscal year that included the March-June 2020 period, and 2019 is the preceding year. The margin shown is the difference between the total revenues received from all sources (including grants and revenues from activities other than patient services) and the total expenses incurred by the hospital, divided by the total expenses.
Hospitals had higher total margins even with lower margins on patient services because of the large amounts of government aid they received during the pandemic. The federal government provided several different types of financial assistance to hospitals in an effort to offset the negative impacts of the pandemic:
- Provider Relief Fund (PRF). Congress authorized $178 billion in Provider Relief (PRF) funding to cover financial losses and unexpected costs incurred by hospitals and other healthcare providers during the pandemic. The initial funds received by hospitals were equivalent to at least 2% of their 2018 patient revenue. Additional amounts were then provided for hospitals that serve a large number of low-income patients, hospitals that treated a large number of COVID-19 patients, and hospitals that had losses or higher costs between July 2020 and March 2021. The median award for rural hospitals was about $5 million, but large rural hospitals received much larger awards.
- American Rescue Plan (ARP) Rural Funds. Congress also authorized $8.5 billion in ARP funds specifically for hospitals and other providers that serve patients in rural areas to help cover lost revenue and costs associated with COVID-19. The median award for rural hospitals was about $1 million.
- Paycheck Protection Program (PPP). Congress authorized $659 billion for PPP loans to businesses and nonprofit organizations, including hospitals, if they had 500 or fewer employees. These loans were forgiven (i.e., converted into a grant) if the hospital maintained payroll and compensation levels during the initial months of the pandemic. The median amount received by rural hospitals that were eligible and applied was about $2 million.
- Advance Payments from Medicare. If a hospital requested it, the Centers for Medicare and Medicaid Services (CMS) provided an advance on the Medicare payments the hospital would expect to receive for services it delivered in future months. Not every hospital requested an advance, but most of those that did received millions of dollars in advance payments. These payments were not grants, but loans intended to help improve cash flow for the hospital during the pandemic. Hospitals have to repay these funds to CMS by the end of 2022.
All of this funding helped rural hospitals stay afloat during the pandemic, particularly the small rural hospitals that needed help the most. Although bigger hospitals received larger amounts of funds in absolute terms, small rural hospitals received more funds in relative terms. For example, Federal Provider Relief Fund awards were equivalent to more than 20% of total expenses at small rural hospitals, but less than 15% for larger rural hospitals and less than 5% for most urban hospitals.
Figure 31
Provider Relief Fund Awards as % of Total Hospital Expenses
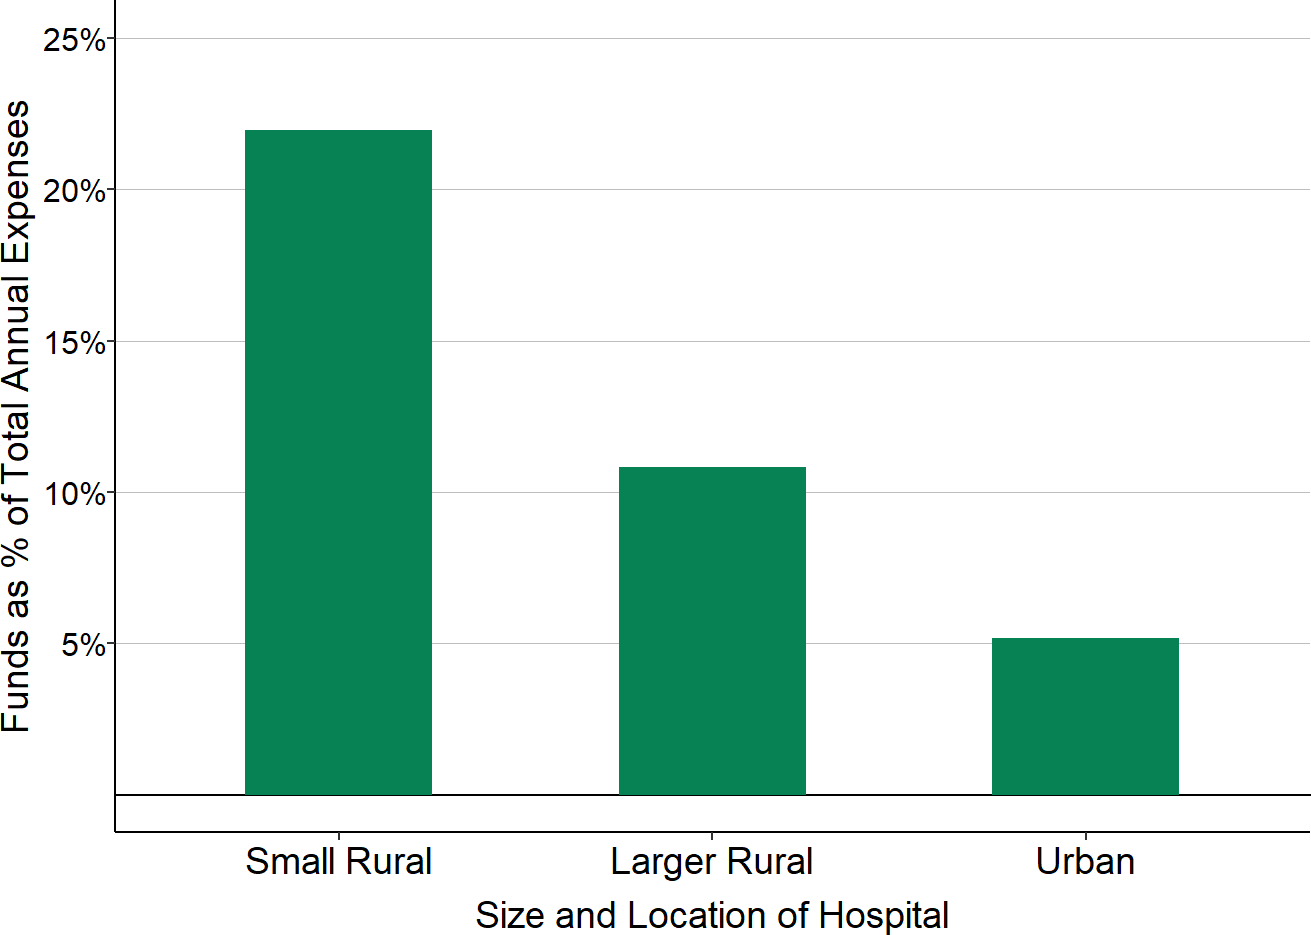
“Small Rural” hospitals are rural hospitals with less than $45 million in total annual expenses. The percentage shown is the median of the estimated total amount each hospital received in Provider Relief Funds divided by the hospital’s total expenses. The amount of Provider Relief Funds a hospital received could not be determined in cases where the funds went to parent corporations or entities with different names than the hospital.
However, hospitals can only keep the funds from the Provider Relief Fund and the American Rescue Plan if they are used “for health care related expenses or lost revenues that are attributable to coronavirus.” The Provider Relief Fund awards were so large that most small hospitals were only able to use a portion of the funds in 2020. Since the pandemic continued into 2022, hospitals were able to recognize additional portions of the funds in 2021 and 2022, but it is possible that some hospitals will have to return a portion of the funds they received.
Pandemic Aid Made Rural Hospitals Appear Healthier Than They Really Are
A disadvantage of the large, one-time funding awards and advance payments is that they make small rural hospitals appear stronger financially than they really are. For example:
- “Days cash on hand” is a misleading measure of financial health. “Days cash on hand” is a metric commonly used to assess the financial health of a hospital; it represents the number of days that the hospital could cover its expenses if it received no additional revenues beyond the cash and short-term investments that it already has. Prior to the pandemic, most small rural hospitals had less than two months of cash on hand, and many had less than 30 days. By the end of their 2020 fiscal years, most small rural hospitals had more than 6 months of cash on hand. However, 1-2 months of that amount represented the payment advances from Medicare; as those advances are repaid, there will be a corresponding decrease in the hospitals’ cash on hand. In addition, a hospital was only be able to keep all of the Provider Relief Fund and American Rescue Plan funds it received if it incurred corresponding losses or higher costs due to COVID-19. Those losses and costs reduced the hospital’s cash reserves, offsetting the increase resulting from the awards. Consequently, days cash on hand in future years will decrease significantly from the levels in 2020-2021.
- Total margins are a misleading measure of financial health. Similarly, many rural hospitals reported a high total margin in 2021 because of the Provider Relief Fund, American Rescue Plan, and Paycheck Protection Loans they received, and this was also true for many hospitals in 2022. However, this does not mean that the hospitals’ services have suddenly become more profitable. Their total margins will decrease again after all of the federal funds have been used or returned.
Figure 32
Increase in “Days Cash on Hand” From Federal Pandemic Assistance
Rural Hospitals with Less Than $45 Million in Annual Expenses
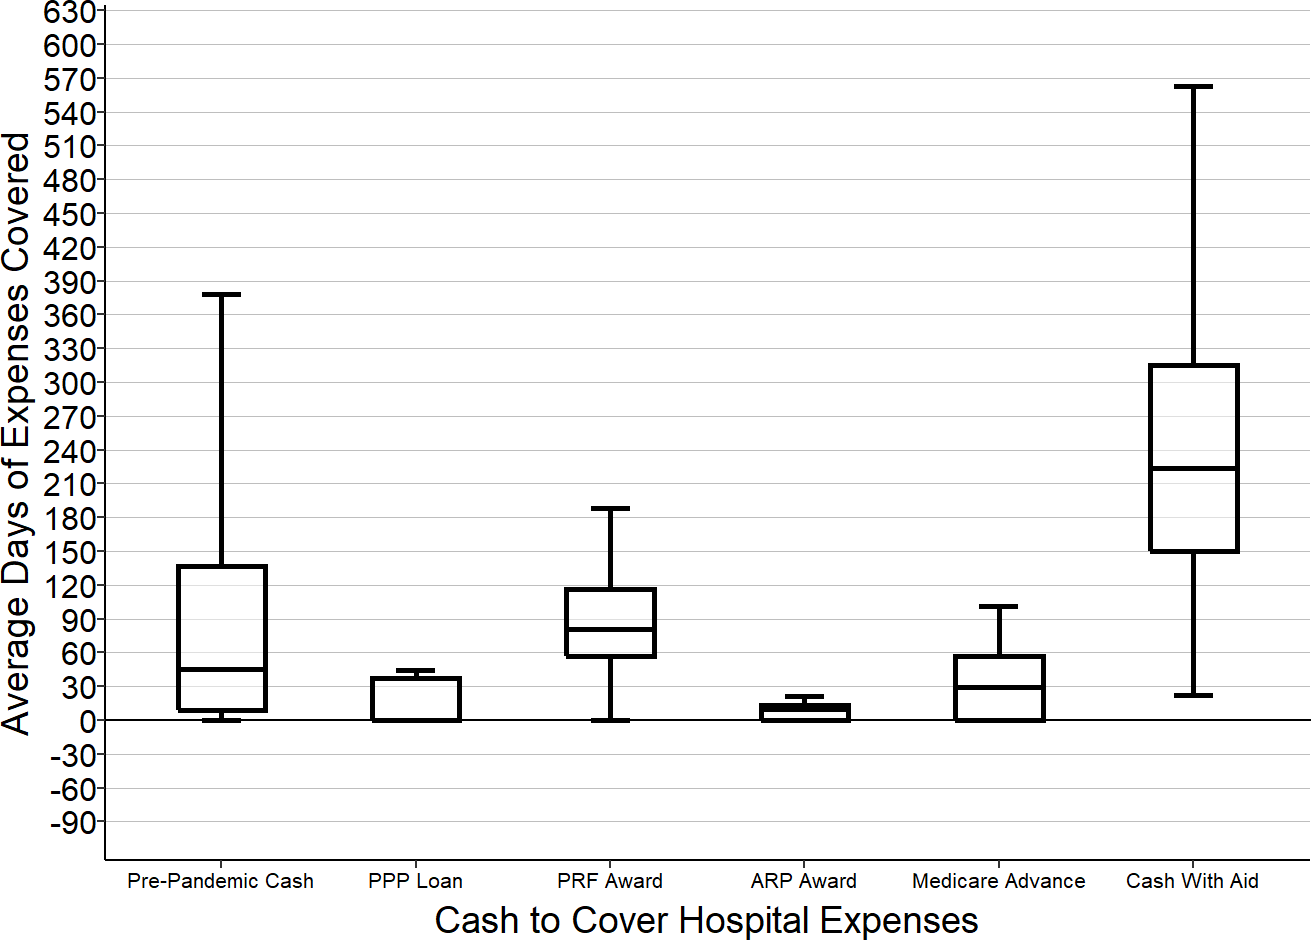
“Cash” includes cash and short-term investments.
“Day of Expenses Covered” is the amount of cash divided by the hospital’s average expenses per day (not including depreciation).
“Cash with Aid” represents the cash on hand at the end of 2019 plus all four types of federal funds received during the pandemic. Because funds were provided at different times, and because the funding was used to cover expenses that occurred at different times, this amount will differ from the actual amount of cash available at the hospital at any specific point in time.
Differences by State
The analysis above demonstrates that in general, losses on services to patients with private insurance contribute more to low margins or losses at small rural hospitals than do losses on Medicaid or Medicare patients. However, not all small rural hospitals lose money, not all lose money on private-pay patients, and not all of them lose more on private-pay patients than on Medicaid or Medicare patients.
One of the primary determinants of this variation is the state in which the hospital is located. Payment amounts, patient cost-sharing, and eligibility in private insurance and Medicaid programs differ dramatically from state to state, and this causes the financial status of rural hospitals to also differ dramatically across states.
Variation in Total Margin
In the majority of states, at least one-fourth of small rural hospitals are losing money, and in four states, the majority of the small rural hospitals have had losses.41.
Many of the states in which a high percentage of small rural hospitals are currently losing money have also had many rural hospital closures over the past decade, as shown in the map below.
Figure 33
Percentage of Small Rural Hospitals with Negative Total Margins
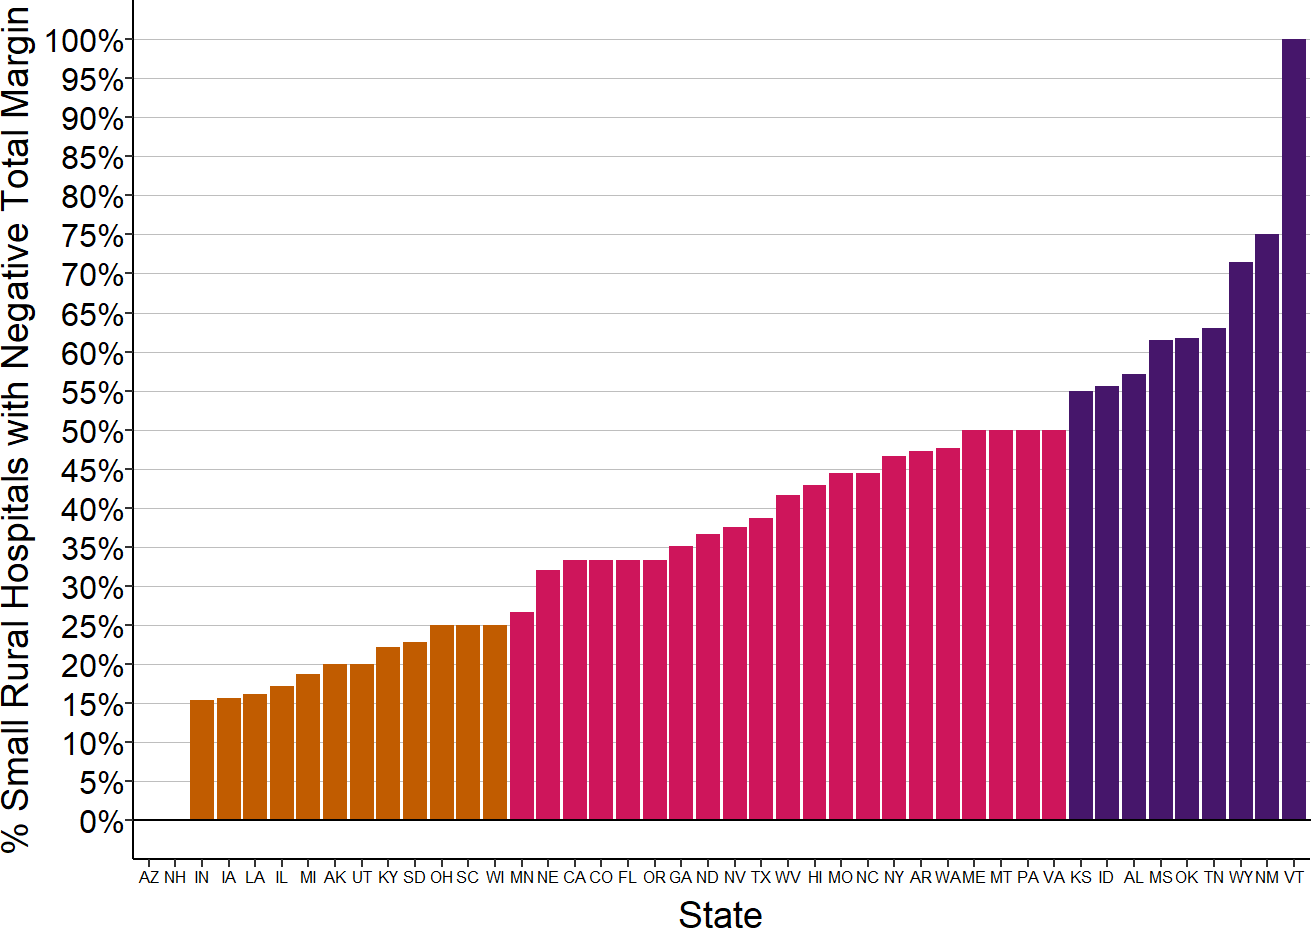
Total margin for the most recent year available for rural hospitals located in the state with less than $45 million in expenses.
Figure 34
Percentage of Small Rural Hospitals with Negative Total Margins
and Number of Rural Hospital Closures
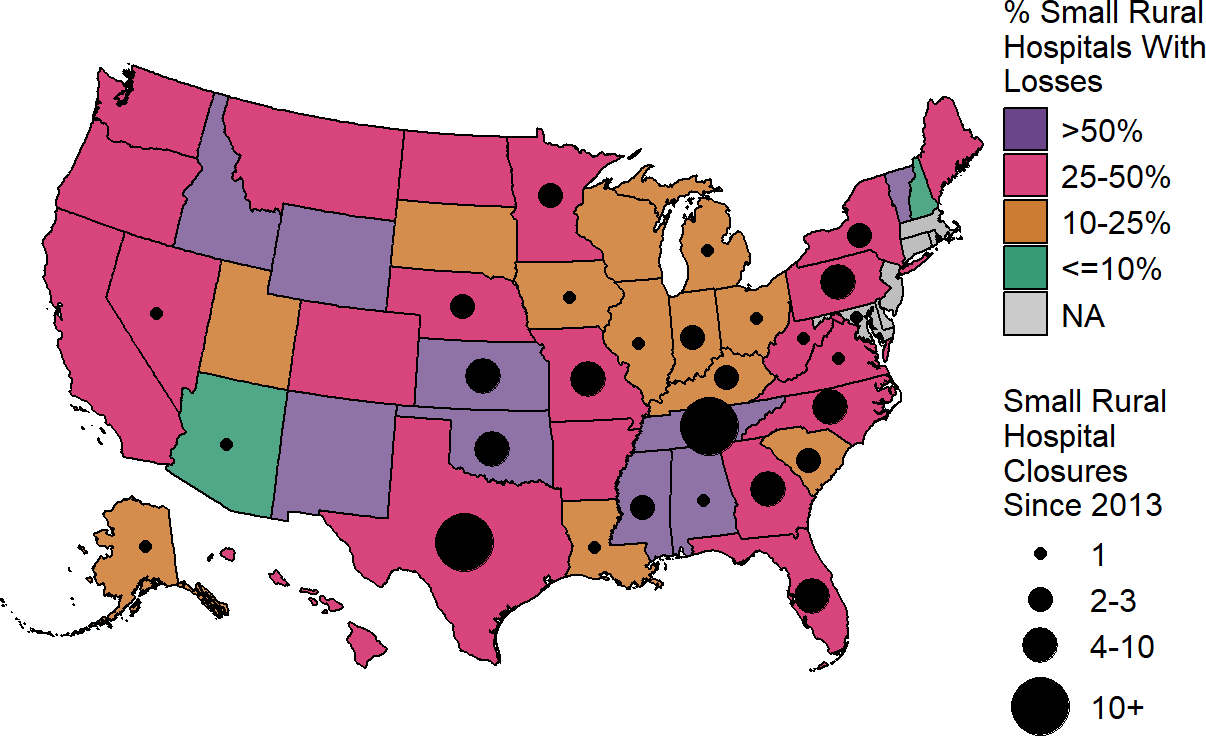
Total margin in most recent year available for rural hospitals located in the state with less than $45 million in expenses. Closures are those reported by the Sheps Center for Health Services Research. States shown in gray have no small rural hospitals.
Variation in Private Payer Payments
A major reason for the variation across states in the percentage of small rural hospitals losing money is the variation in the percentage losing money on private-pay patients. Although the median margin for patients with private insurance at small rural hospitals is 0%, there is wide variation above and below that median. More than one-fourth of the hospitals had losses of 15% or more, while one-fourth of the hospitals made profits of 15% or more.
Much of that variation is driven by where the hospital is located. In more than half of the states, the majority of small rural hospitals lose money on patients with private insurance, and in 9 states, the majority of the small rural hospitals have had losses of 10% or more on private-pay patients.
Figure 35
Proportion of Small Rural Hospitals
With Losses on Patients with Private Insurance
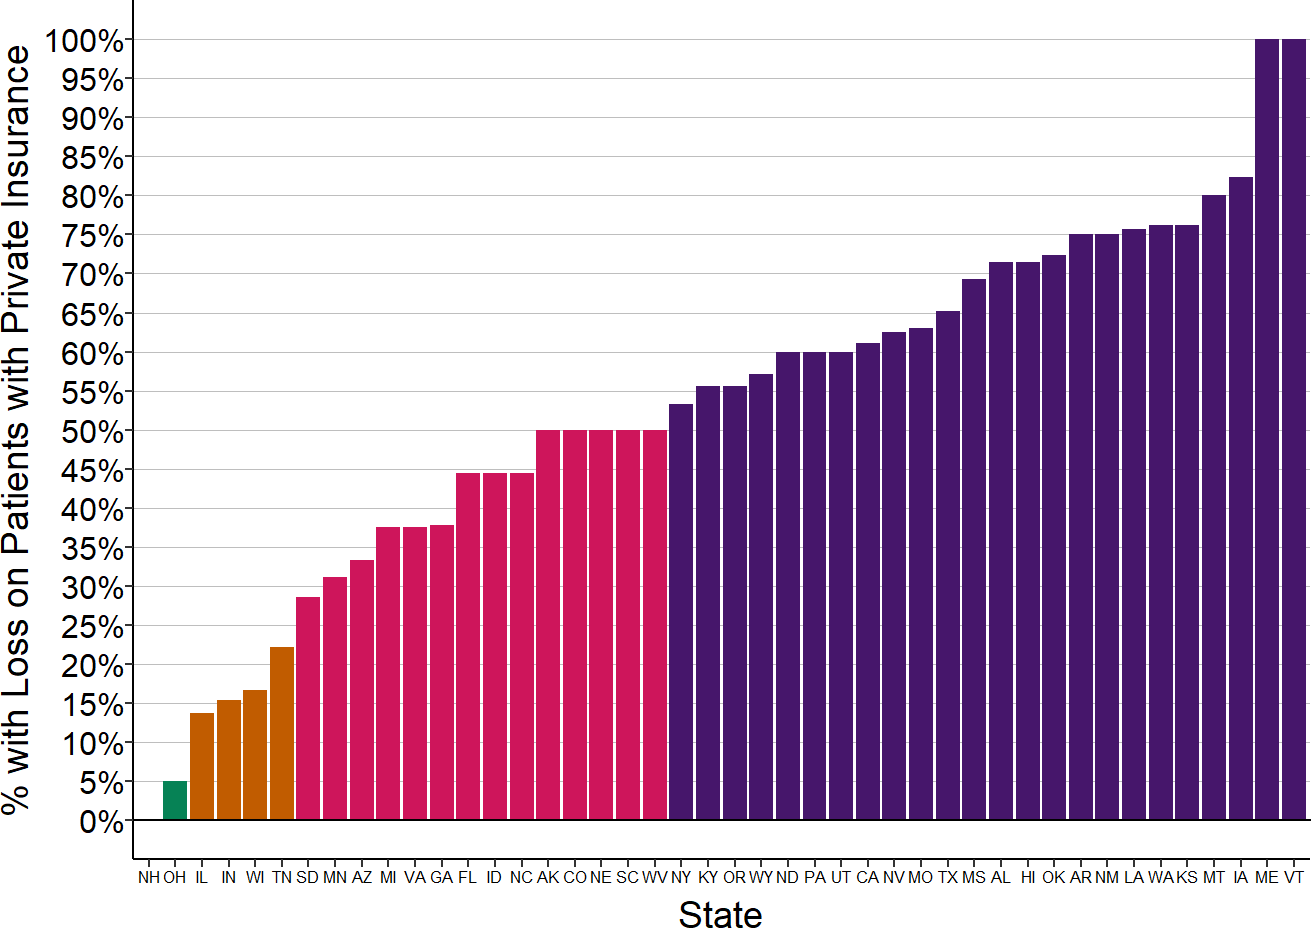
Margins on services to patients with insurance from private health plans in the most recent year available for rural hospitals located in the state with less than $45 million in expenses.
Figure 36
Proportion of Small Rural Hospitals
With Losses on Patients with Private Insurance
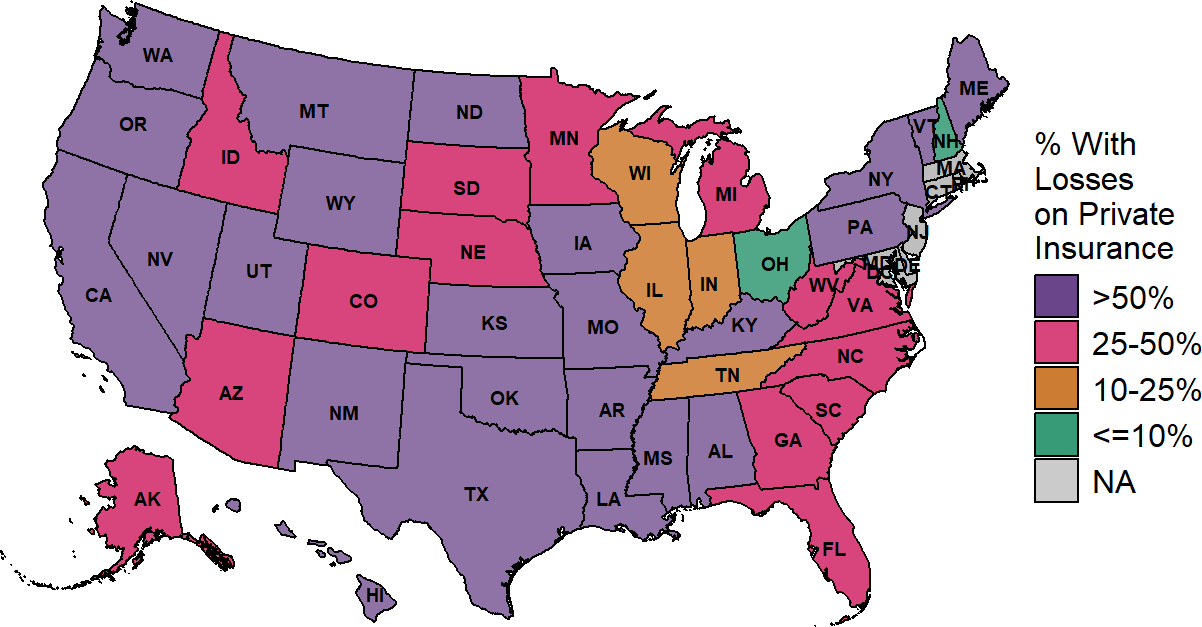
Margin on services to patients with insurance from private health plans in the most recent year available for rural hospitals located in the state with less than $45 million in expenses.
Variation in Patient Bad Debt
There are also significant differences across states in the amounts very small rural hospitals lose due to patient bad debt. In some states, this reduces hospital margins by only 1-2%, but for small rural hospitals in many states, the median loss is more than 3%.
Figure 37
Median Bad Debt as % of Expenses at Small Rural Hospitals
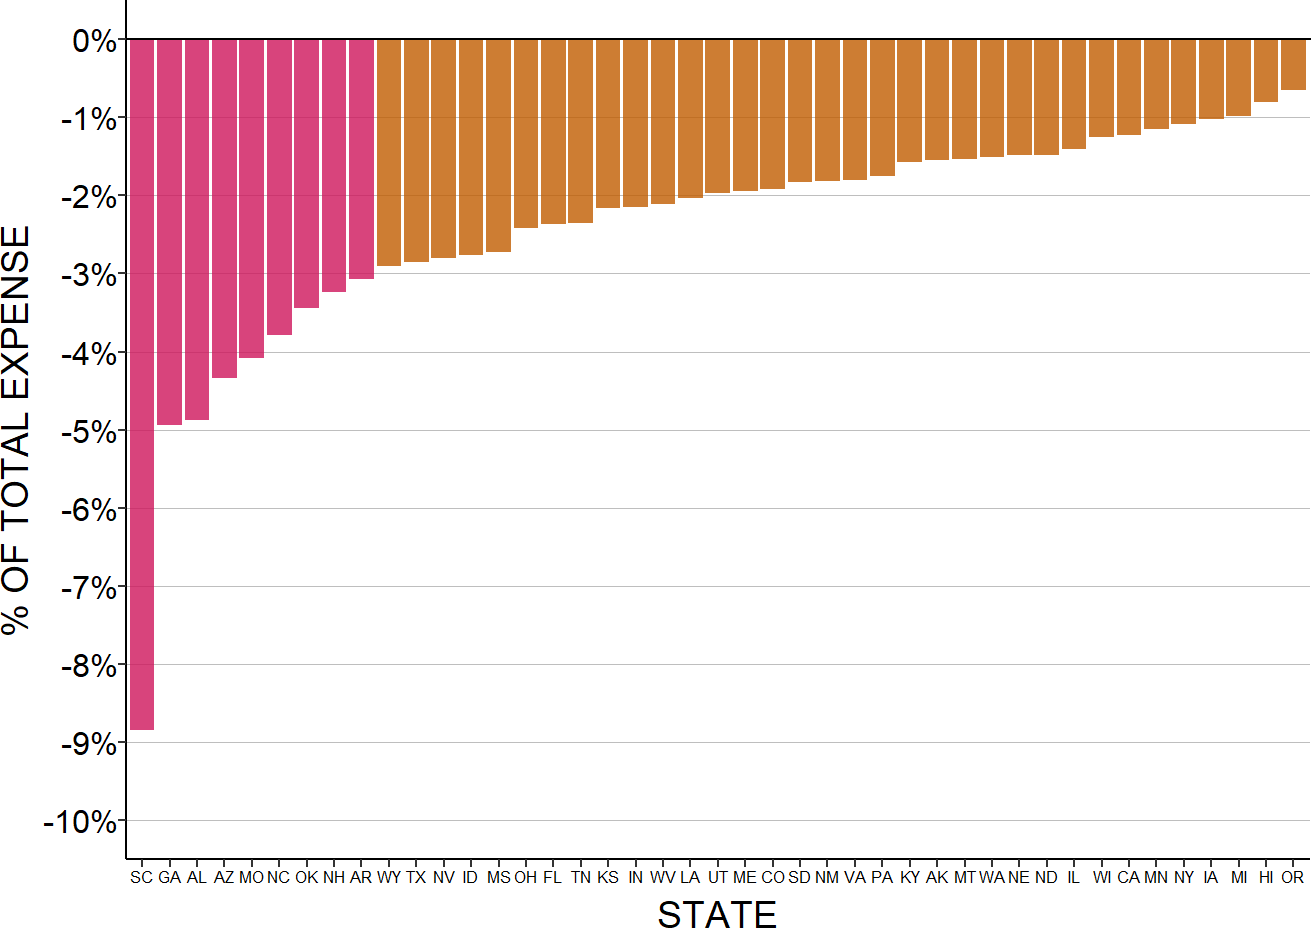
Median for the most recent three years available for rural hospitals located in the state with less than $45 million in expenses. Bad debt is only for patients with private insurance.
The highest losses on unpaid patient obligations are in the southeastern states. Rates of rural poverty are significantly higher in southern states than in other parts of the country, which makes it more likely that individuals living in those states will not have health insurance or be unable to afford cost-sharing amounts in their health insurance plans.
Figure 38
Median Bad Debt as % of Expenses at Small Rural Hospitals
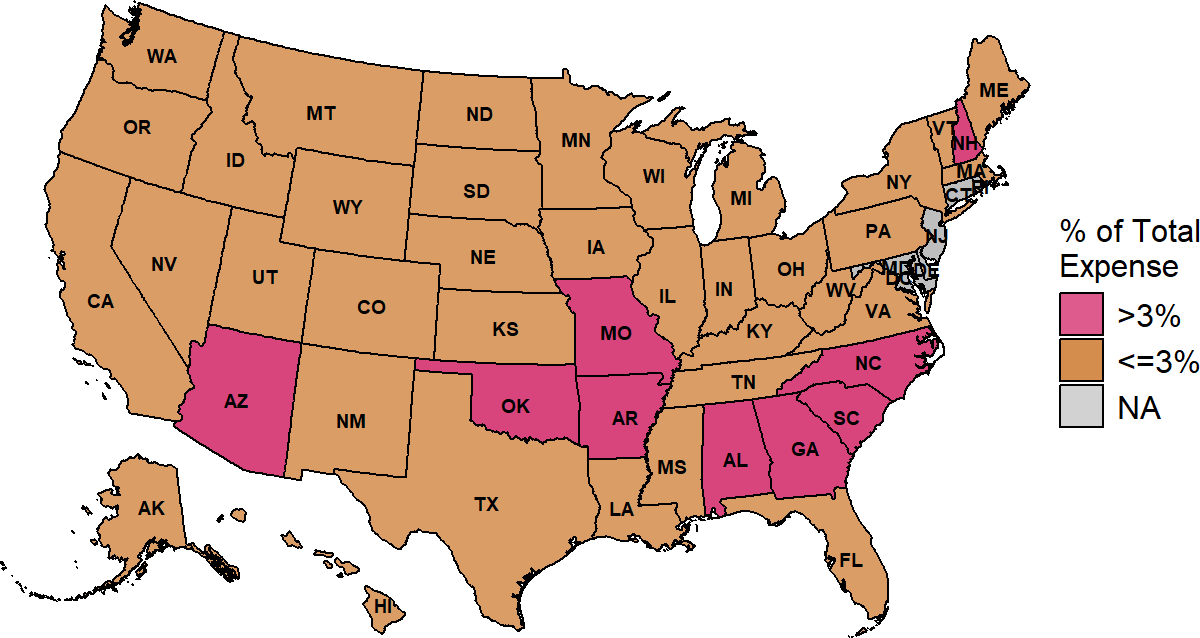
The median is based on the three most recent years available at rural hospitals with less than $45 million in expenses. Bad debt is only for patients with private insurance.
The margins for private-pay patients shown earlier are based on the total amounts the hospital expects to receive from both insurance plans and patients. Patient bad debt increases those losses and reduces the profits.
Figure 39
Median Contributions to Small Rural Hospital Margins
from Private Payer Allowed Amounts and Bad Debt
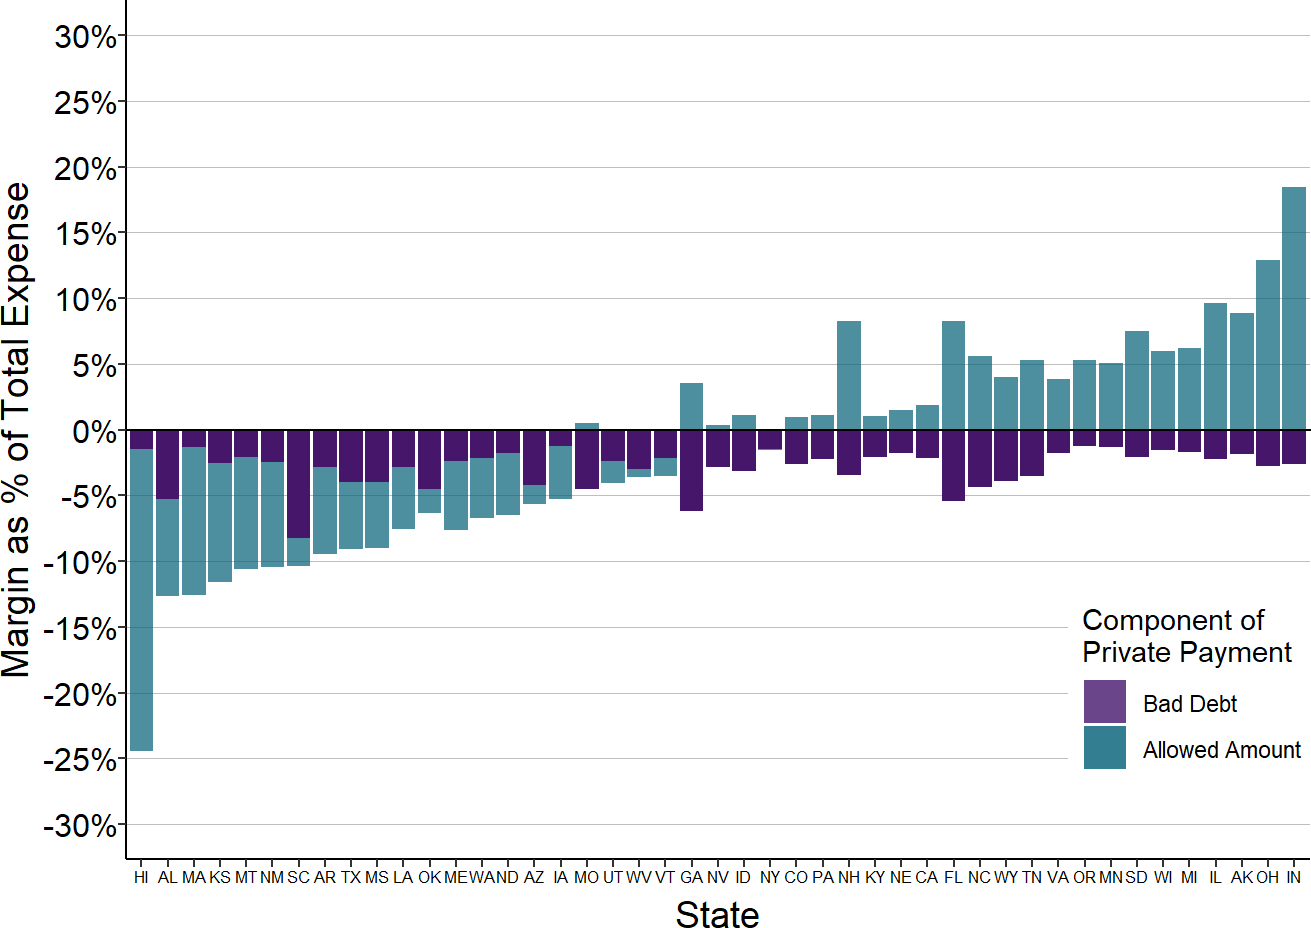
The median is based on the three most recent years available at rural hospitals with less than $45 million in expenses. Bad debt is only for private pay patients.
Variation in Medicaid Payments
There is also significant variation across states in the margins for Medicaid patients treated at small rural hospitals. Some state Medicaid programs use cost-based payment for services delivered by Critical Access Hospitals and special payment rates at other hospitals that result in positive margins or small losses for services delivered to Medicaid patients. In contrast, many other states have standard payment schedules for all hospitals that financially disadvantage small rural hospitals where the cost of delivering services is higher.42
Losses on Medicaid patients are highest in states in the upper Midwest and West, whereas the majority of very small rural hospitals in the Southeast report positive margins on services to Medicaid patients.
Figure 40
Median Margin on Medicaid Patients
at Small Rural Hospitals
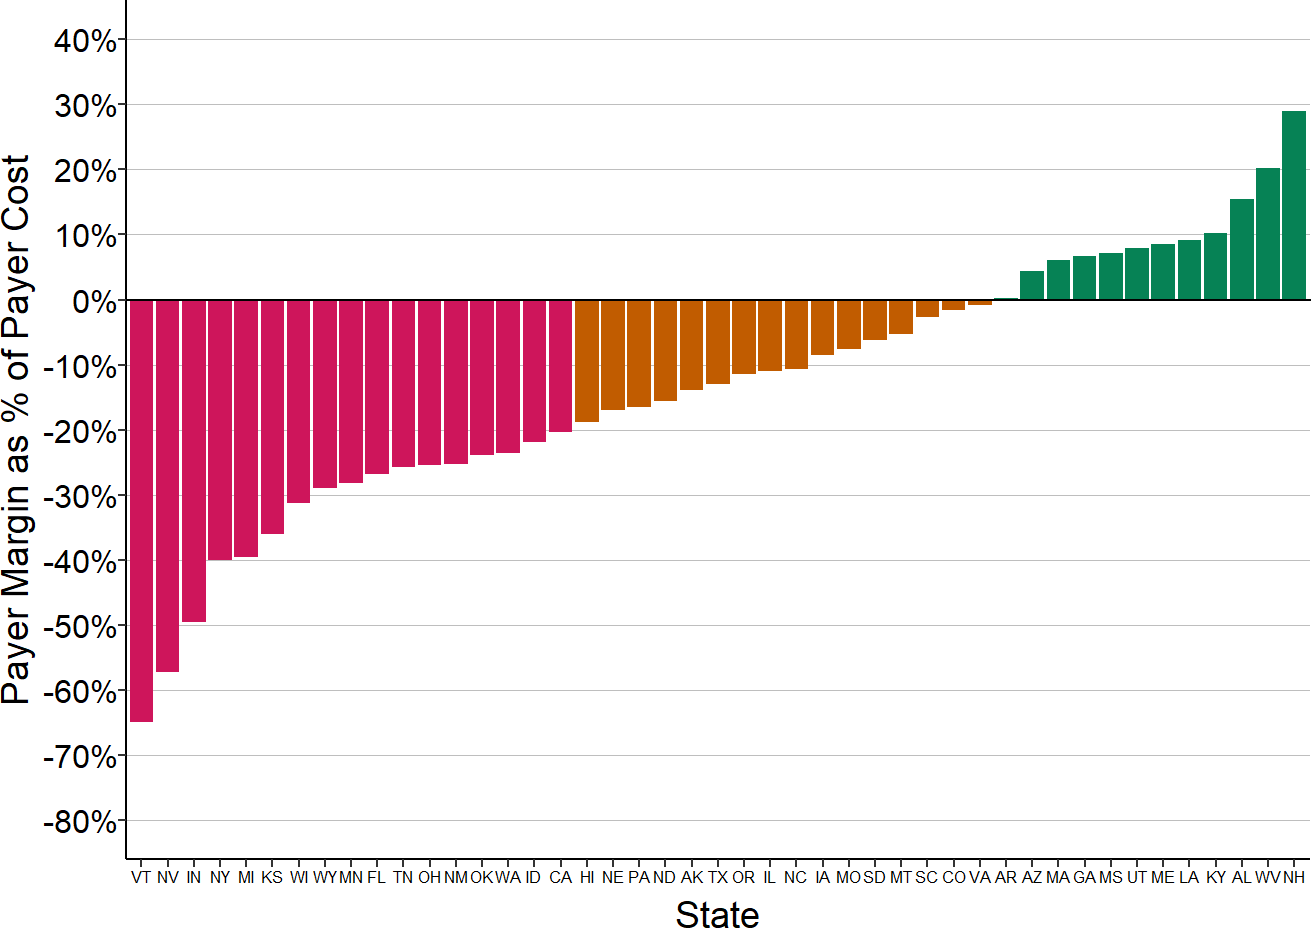
The median is based on the three most recent years available at rural hospitals with less than $45 million in expenses.
Figure 41
Median Margin on Medicaid Patients
at Small Rural Hospitals
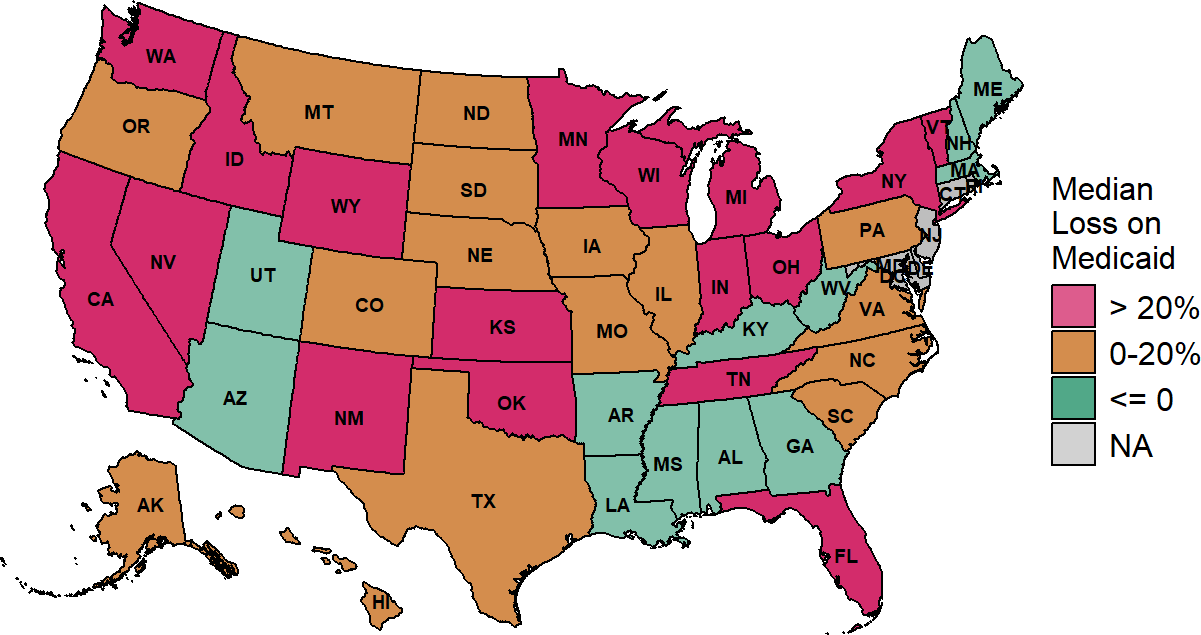
The median is based on the three most recent years available at rural hospitals with less than $45 million in expenses.
The Impact of Medicaid Expansion
Medicaid programs differ from state to state not only in the amounts paid for services, but in terms of eligibility requirements. The tighter the eligibility requirements in the state, the more likely it is that people living in rural areas will be uninsured or have insurance plans with high cost-sharing requirements. Consequently, some of the variation in patient bad debt across states could be due to variations in Medicaid eligibility requirements.
After the Affordable Care Act allowed states to broaden eligibility for Medicaid, some states increased income limits to the maximum amount permitted (i.e., “Expansion States”), while others have not done so. In Medicaid expansion states, losses from uninsured charity care cases and bad debt at very small rural hospitals are lower than in non-expansion states. However, losses on services delivered to patients who do have Medicaid are higher in the expansion states because the Medicaid payment rates are lower relative to costs than in the non-expansion states. The net effect is that small rural hospitals in Medicaid expansion states have smaller losses than hospitals in non-expansion states, but the difference is less than what one might expect or hope to see based on the difference in insurance coverage alone.
Figure 42
Median Contributions to Total Margin from
Medicaid, Uninsured, and Bad Debt
in States That Did and Did Not Expand Medicaid
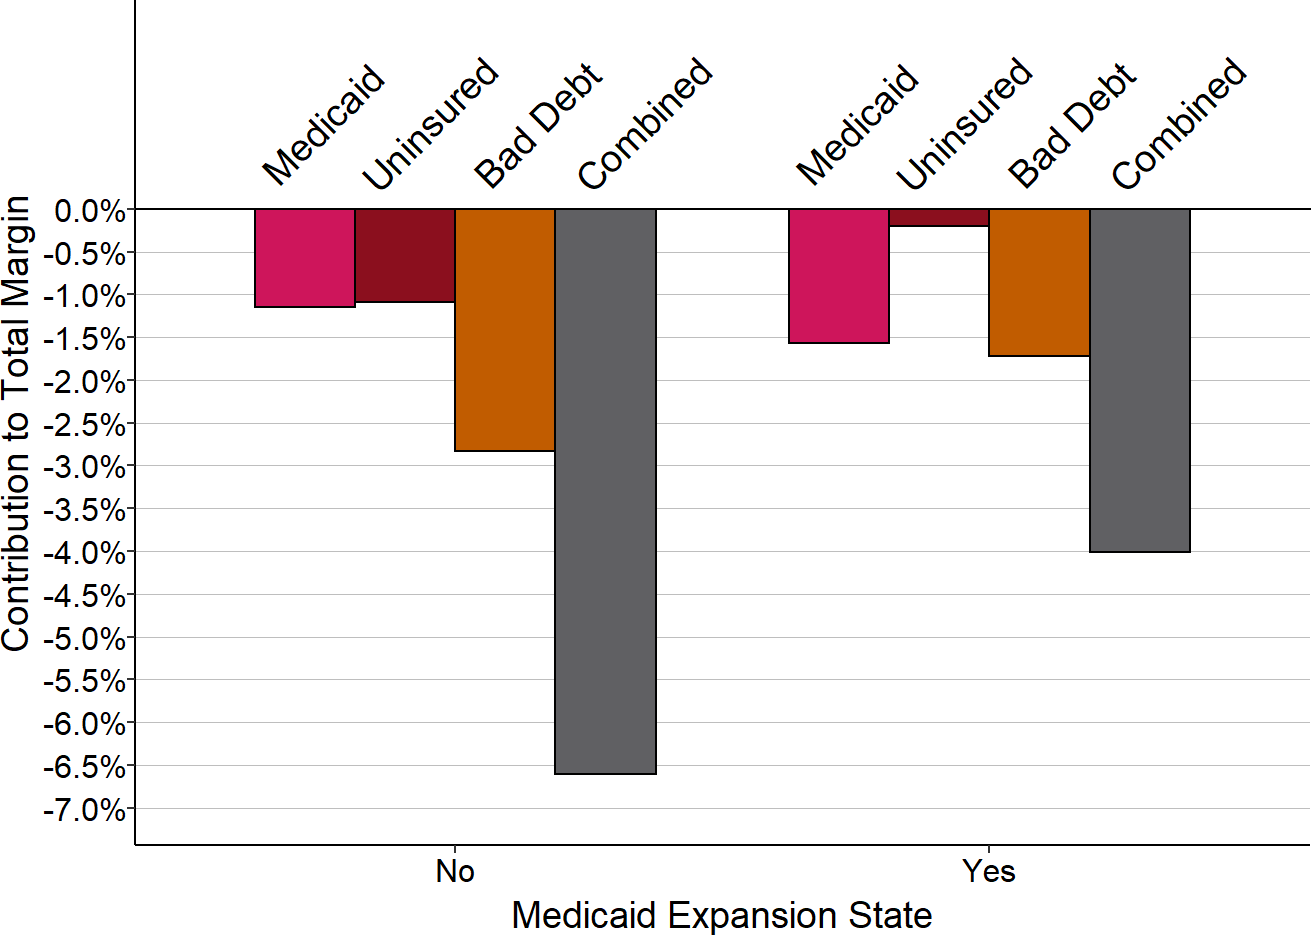
The median is based on revenues and expenses in the most recent year available at rural hospitals with less than $45 million in expenses in each group of states.
In Medicaid expansion states, median losses on both uninsured charity cases and bad debt decreased at small rural hospitals following expansion. In non-expansion states, although losses on uninsured charity cases at small rural hospitals increased, losses on bad debt decreased, resulting in a net reduction in combined losses from those two categories. The losses in both categories were lower in expansion states than in non-expansion states prior to expansion and the combined losses remained lower after expansion.
In expansion states, losses on services to Medicaid patients at small rural hospitals increased following expansion, whereas losses in non-expansion states decreased. It is possible that the funding used to pay for expansion limited the ability to increase Medicaid payments to hospitals in expansion states.43
The net effect was a reduction in the combined losses from all three categories in expansion states, and a smaller decrease in non-expansion states. However, most small rural hospitals in both expansion and non-expansion states continue to lose money on both Medicaid and uninsured patients.
Figure 43
Contributions to Small Rural Hospital Margins
in States That Expanded Medicaid
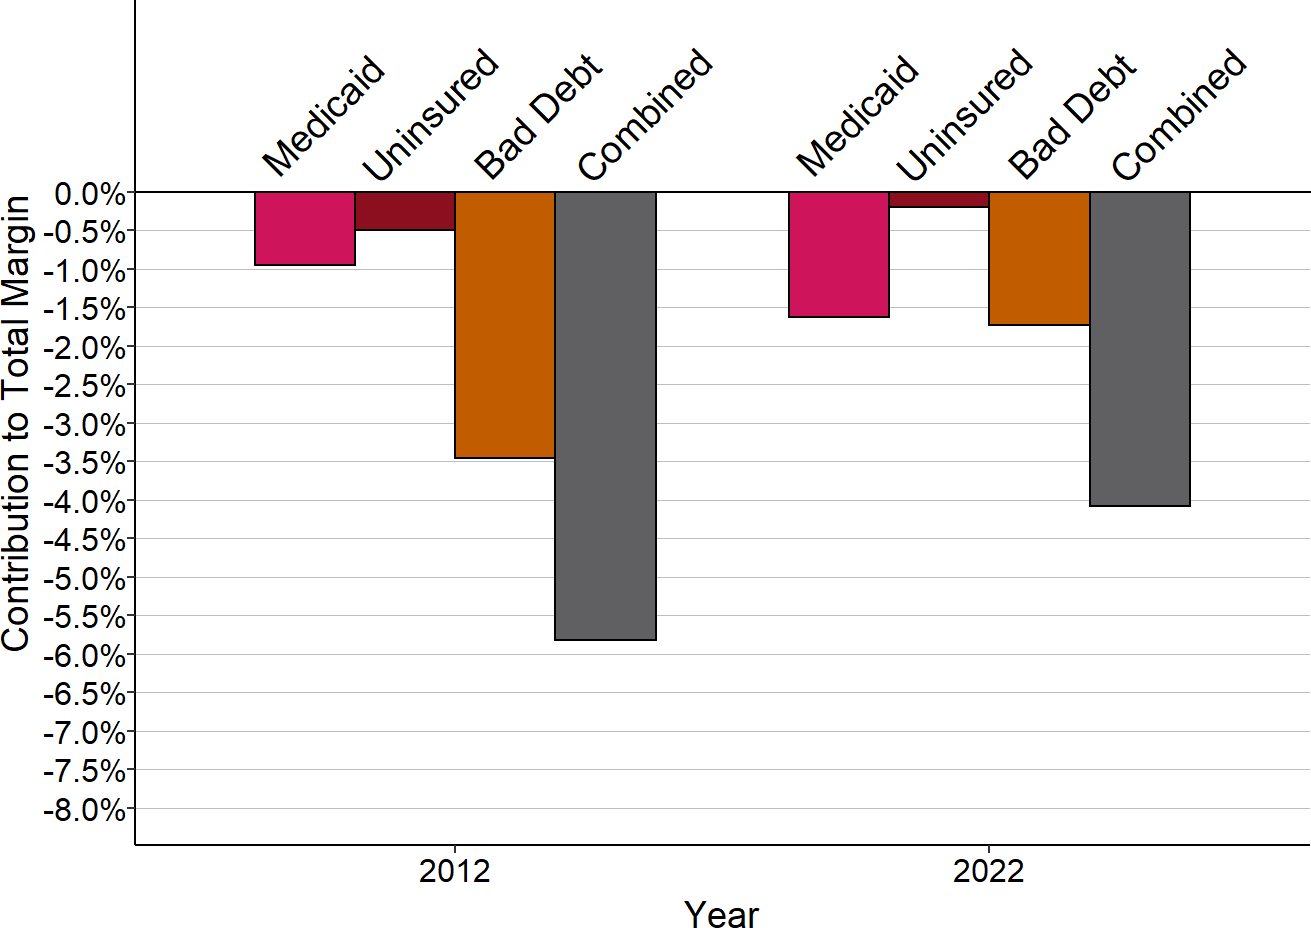
Small rural hospitals are those with total expenses below the median in each year. 2012 is pre-expansion, 2024 is post-expansion.
Figure 44
Contributions to Small Rural Hospital Margins
in States That Did Not Expand Medicaid
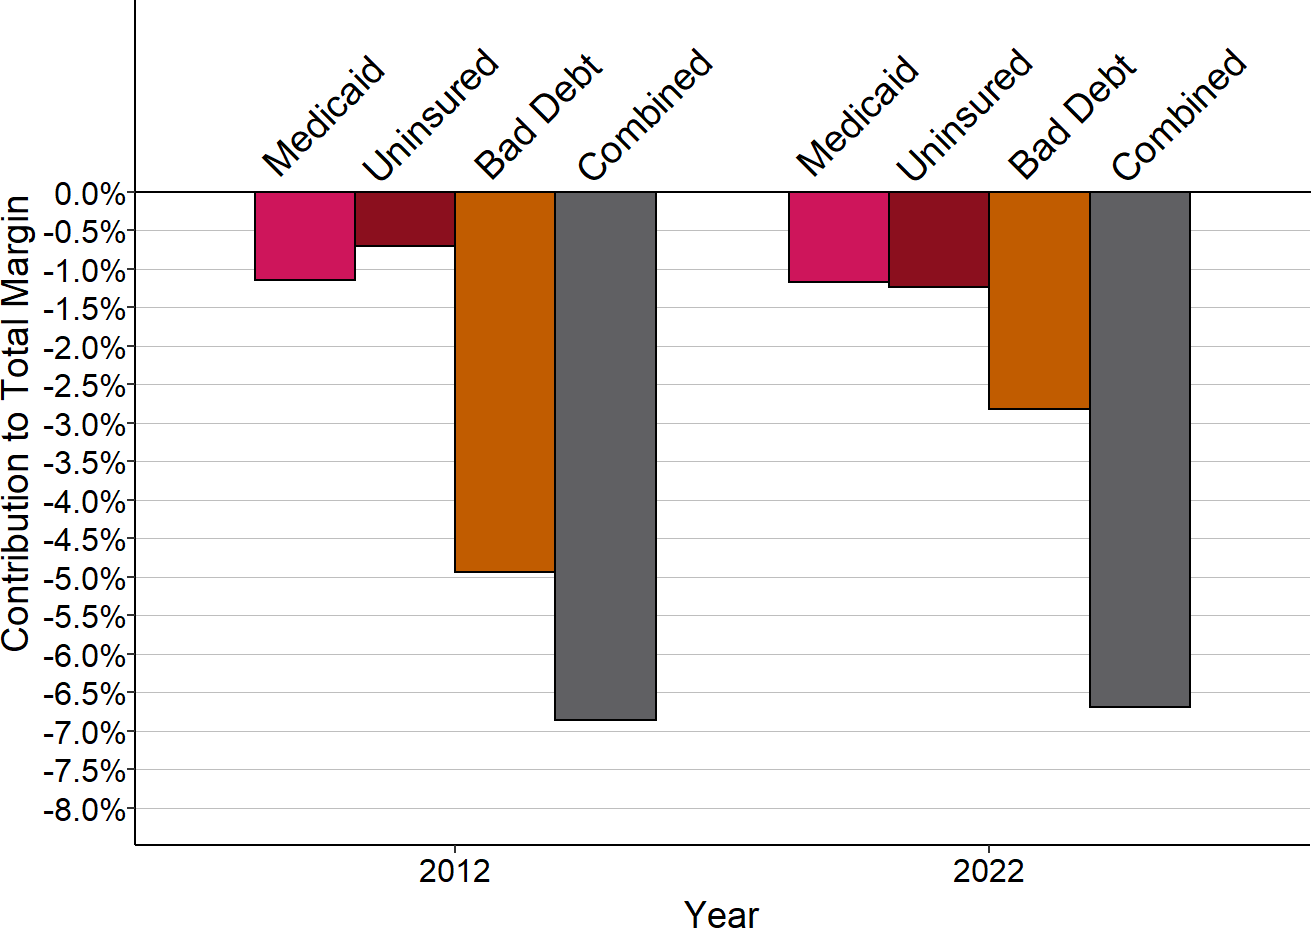
Small rural hospitals are those with total expenses below the median in each year.
Variation in Medicare Margins
There is also variation across states in the margins that small rural hospitals receive on services to Medicare patients, but the magnitude of the variation is much smaller than for Medicaid and private-pay patients. In most states, median Medicare margins at small rural hospitals are between -4% and +4%, in contrast to the double-digit positive and negative margins for other payers.
The variation across states is not because Medicare pays different amounts in different states, but because of differences in the Medicare classifications of rural hospitals in different states. In states that have the lowest population densities, small rural hospitals are more likely to meet the criteria required for designation as a Critical Access Hospital, and therefore they can be paid by Medicare based on their costs.
Variation in Patient Service Margins
In combination, the losses on private pay patients, Medicaid patients, bad debt, and uninsured patients means that in most states, the majority of small rural hospitals lose money delivering services to patients. In one-third of the states, the majority of small rural hospitals lose more than 5% on delivery of services to patients.
Figure 45
Median Margin on Patient Services
at Small Rural Hospitals
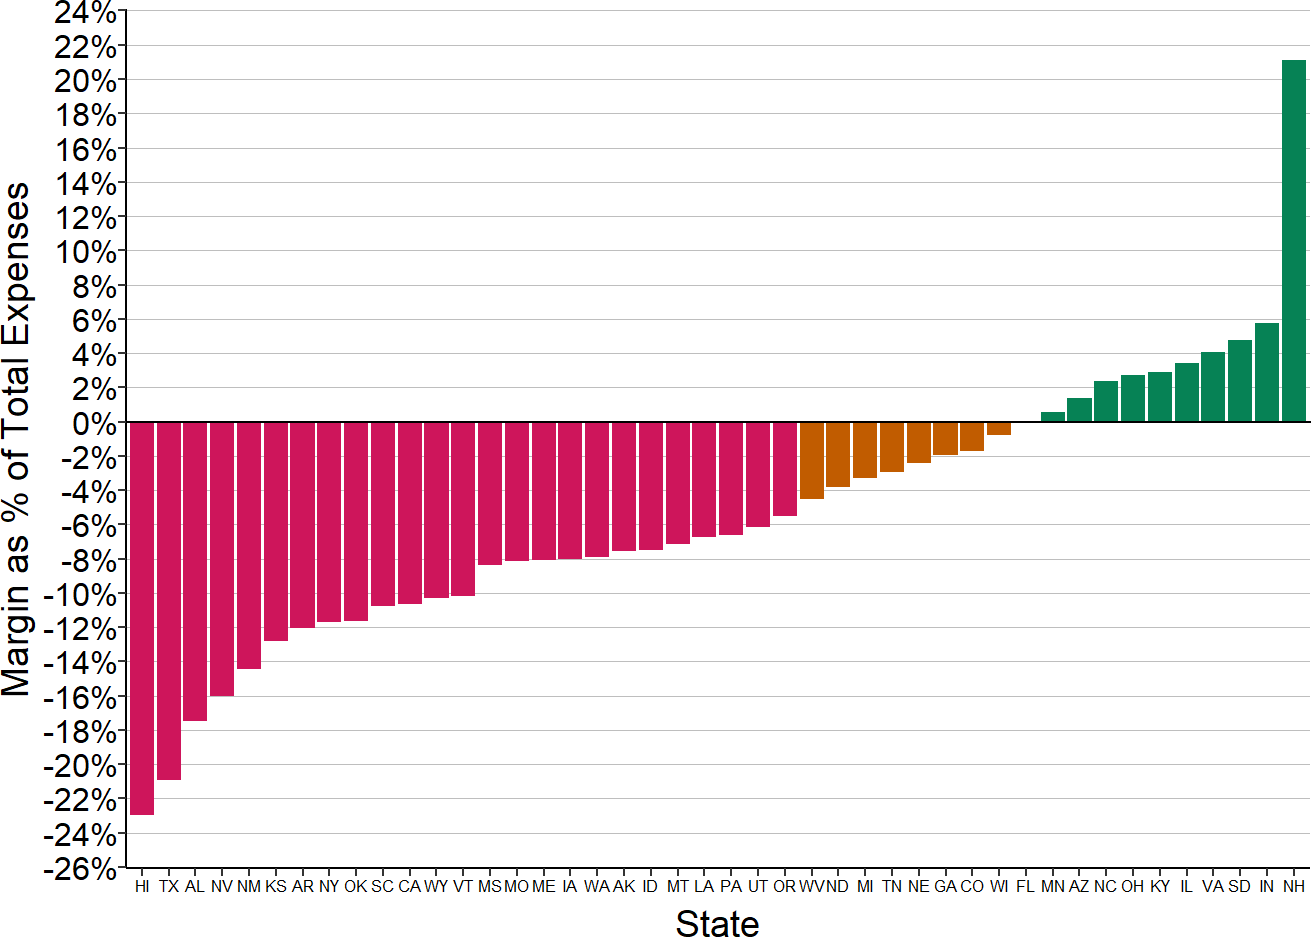
The median is based on the most recent year available for rural hospitals with less than $45 million in expenses.
Variation in Other Income
As noted earlier, the only way that rural hospitals continue operating when they lose money on their services to patients is by obtaining other types of revenue. The amounts of these other sources of revenue vary dramatically by state. In the majority of states, small rural hospitals have to support more than 2% of their costs through revenues that are not tied directly to patient services, and in nine states, non-patient service income supports 10% or more of costs for the majority of the small rural hospitals.
In some cases, these other revenues come from special state programs designed to support rural hospitals.44 For example, Texas has used a special Medicaid waiver program to provide a large amount of additional funding to hospitals beyond what they receive in Medicaid payments for individual services to patients.45
In other cases, small rural hospitals are organized as public hospital districts or are owned by a local government, and the residents of the hospital’s service area have decided to use tax revenues to support the hospital. For example, in Washington State, most small rural hospitals are organized as public hospital districts and many of them use revenues from special local tax levies to offset the losses the hospitals incur due to low payments from Medicaid and private insurance plans.46
Figure 46
Median Amount of Other Income as % of Total Expenses
at Small Rural Hospitals
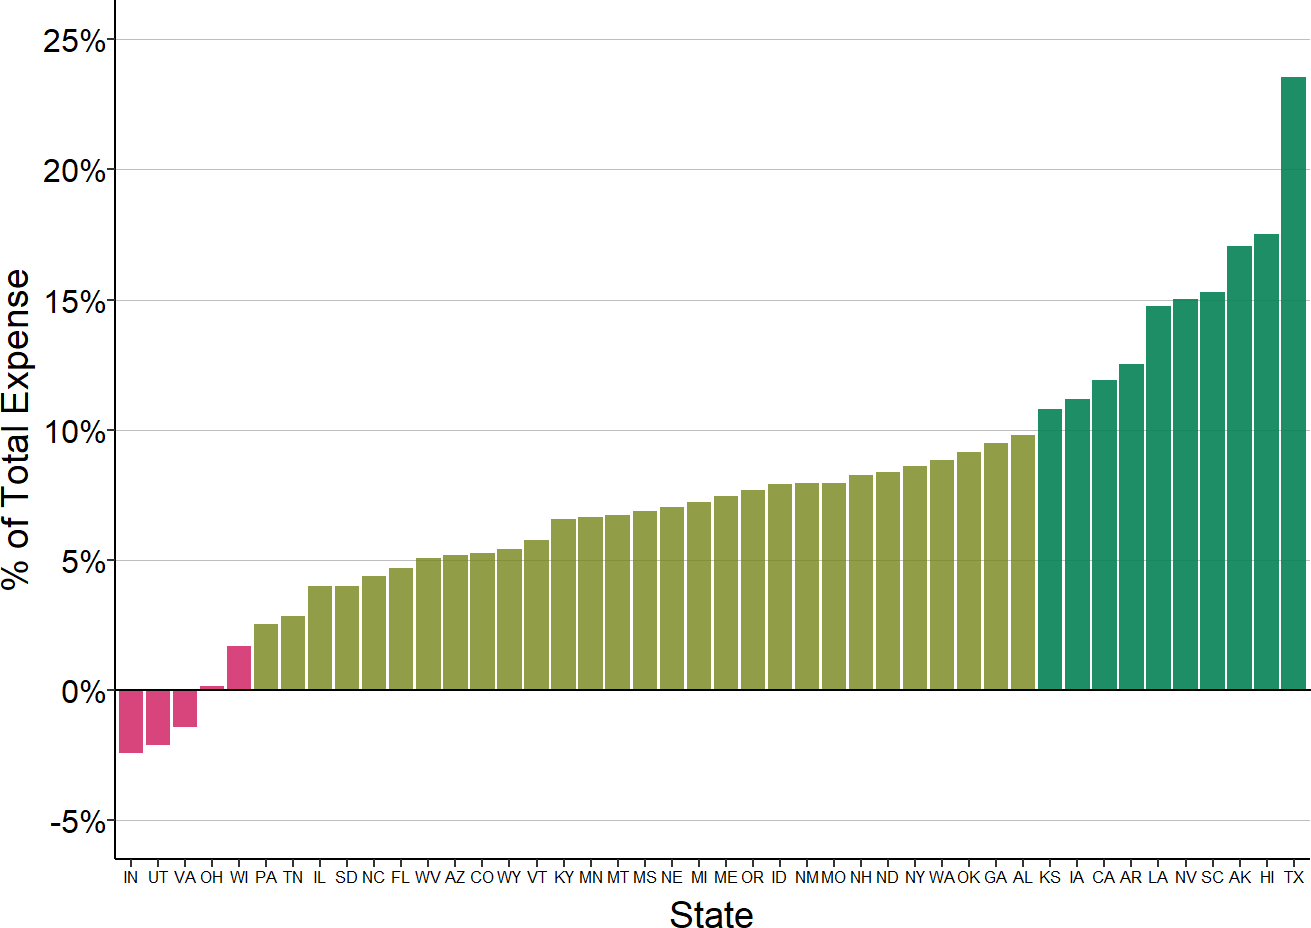
The median is based on the most recent year available for rural hospitals with less than $45 million in expenses. Includes revenues and costs not based on patient services.
Figure 47
Median Amount of Other Income as % of Total Expenses
at Small Rural Hospitals
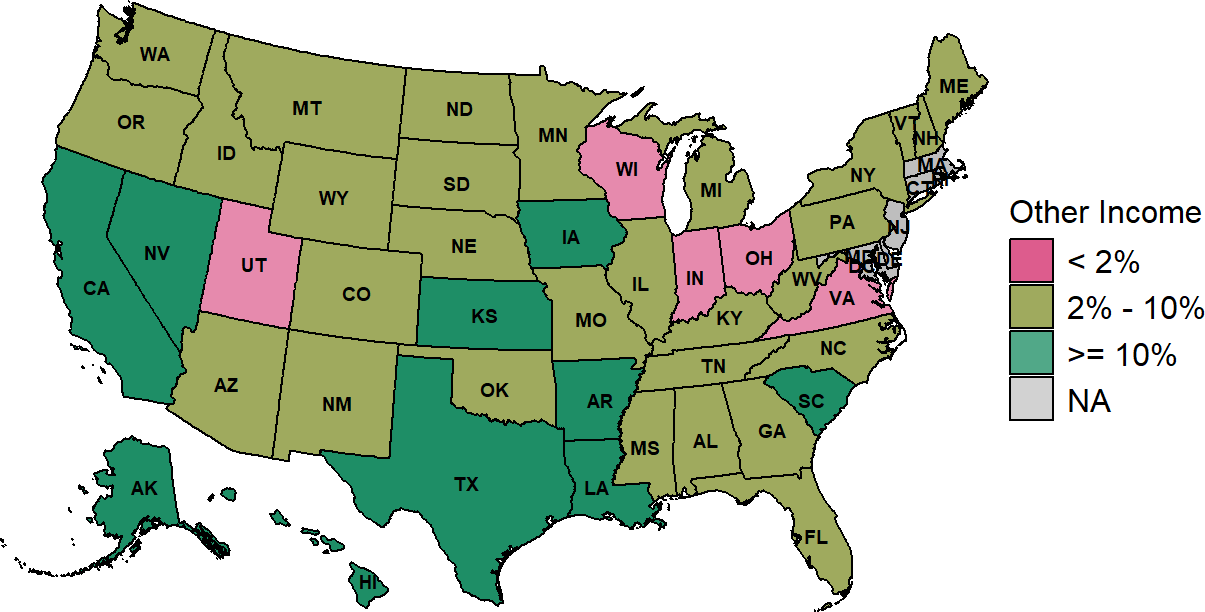
The median is based on the three most recent years available (excluding 2020) at rural hospitals with less than $45 million in expenses.
Other funds contribute more to margins at small rural hospitals located in the western half of the U.S., particularly in the southwest and West Coast. Higher amounts are necessary there because of the losses on both private-pay and Medicaid patients in those states.
While these other revenue sources are vital in keeping small rural hospitals open, they mask the underlying problems with the payments the hospitals receive for patient services. For example, while the majority of very small rural hospitals in Texas and Washington State have positive overall margins, this is only because of the large amounts of non-patient service income they receive. The low private insurance payments the hospitals receive in both states and large amounts of patient bad debt in both states, combined with losses on Medicaid or charity care patients, would make it impossible for the hospitals to continue delivering patient services otherwise.
Figure 48
Payer Contributions to Hospital Margins
at Small Rural Hospitals in Texas and Washington
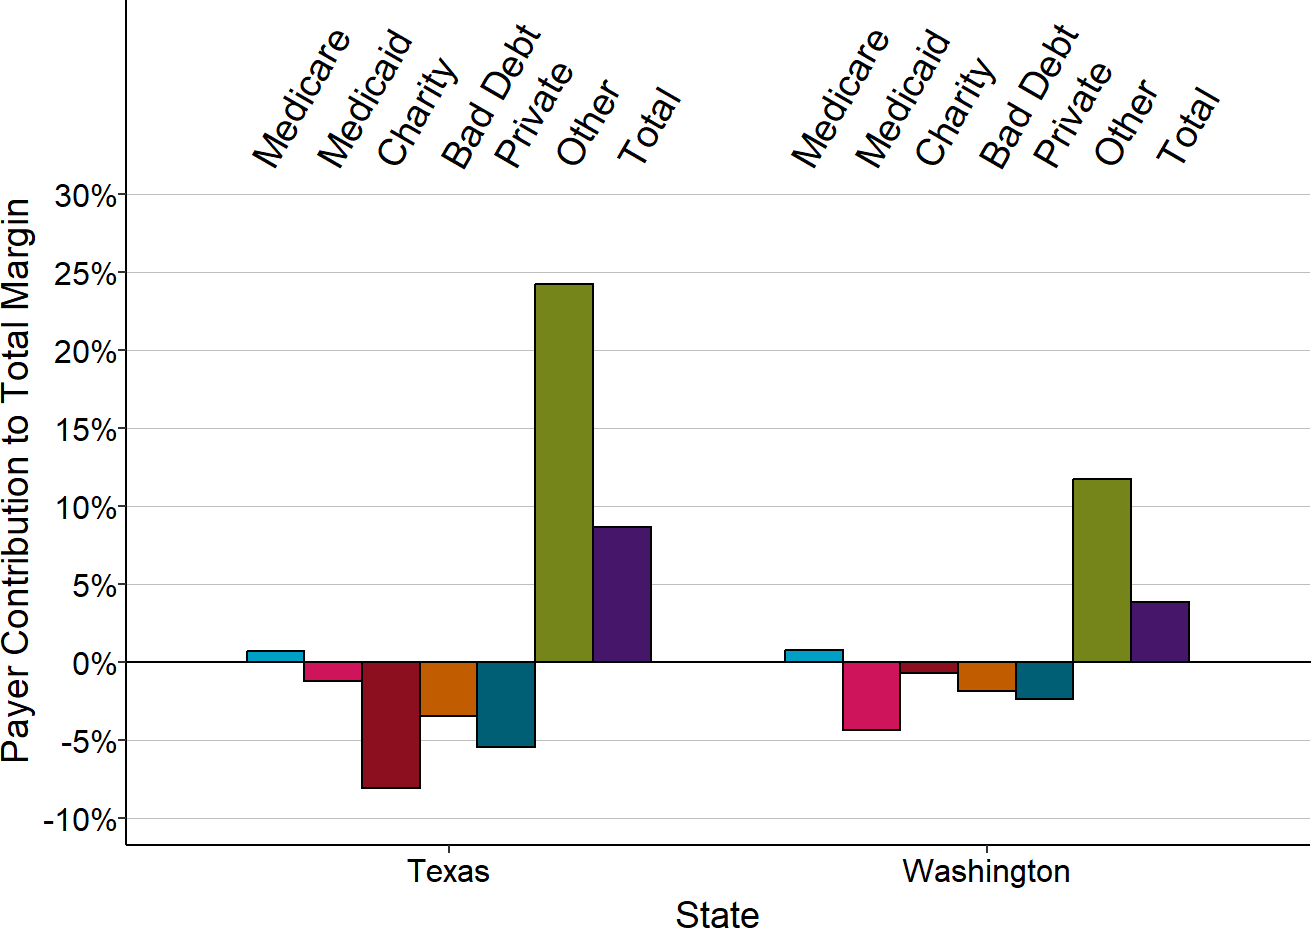
Median for three most recent years available (exluding 2020) at rural hospitals in each state with less than $45 million in expenses.
Which Private Payers Contribute Most to Hospital Losses?
Clearly, private payers are the single biggest factor affecting whether small rural hospitals will lose money and how much they will lose. However, there are many different types of payers in this category, including employer-sponsored and individual commercial insurance plans, Medicare Advantage plans, patients who do not have insurance but who do not qualify for charity care, and patients receiving services not covered by their insurance.47 It is possible that only a subset of these payers is causing most of the losses, and if so, it is important to understand which payers these are.
Another large contributor to hospital losses is patient bad debt. Some of this represents patients without health insurance who do not qualify for charity care, some represents insured patients who fail to pay all or part of the cost-sharing they owe, and some represents patients receiving services that are not covered by their health insurance. It is important to understand how much of these losses are due to lack of insurance vs. under-insurance.
One cannot determine the relative contributions of different private payers using Medicare cost reports, since hospitals are not required to identify specific payers other than Medicare, Medicaid, and CHIP. Nor can one distinguish between bad debt on uninsured patients vs. insured patients using Medicare cost reports, since hospitals only report on uninsured patients that meet the hospital’s charity care standards.
However, a number of states require their hospitals to submit additional information beyond what is contained in Medicare cost reports, and the reports required in California and Tennessee include detailed breakdowns of charges and payments for several major categories of private payers. The reports in Tennessee also distinguish between bad debt for patients who have no insurance vs. those who do. The detailed data from these two states can help to illuminate the reasons for the wide variance in private payer margins across the country.
Profits and Losses Based on Type of Private Insurance in California
Data from California48 for 2015-17 show that margins on services to private-pay patients varied significantly by hospital size, similar to what is seen nationally in the Medicare cost reports. Most of the smallest rural hospitals in California lost money on services to private-pay patients, while most of the larger hospitals made significant profits on them. The majority of hospitals between $16 million and $30 million in total expenses made profits on private payers, but more than 40% had losses.
Figure 49
Private Payer Margins
at California Rural Hospitals
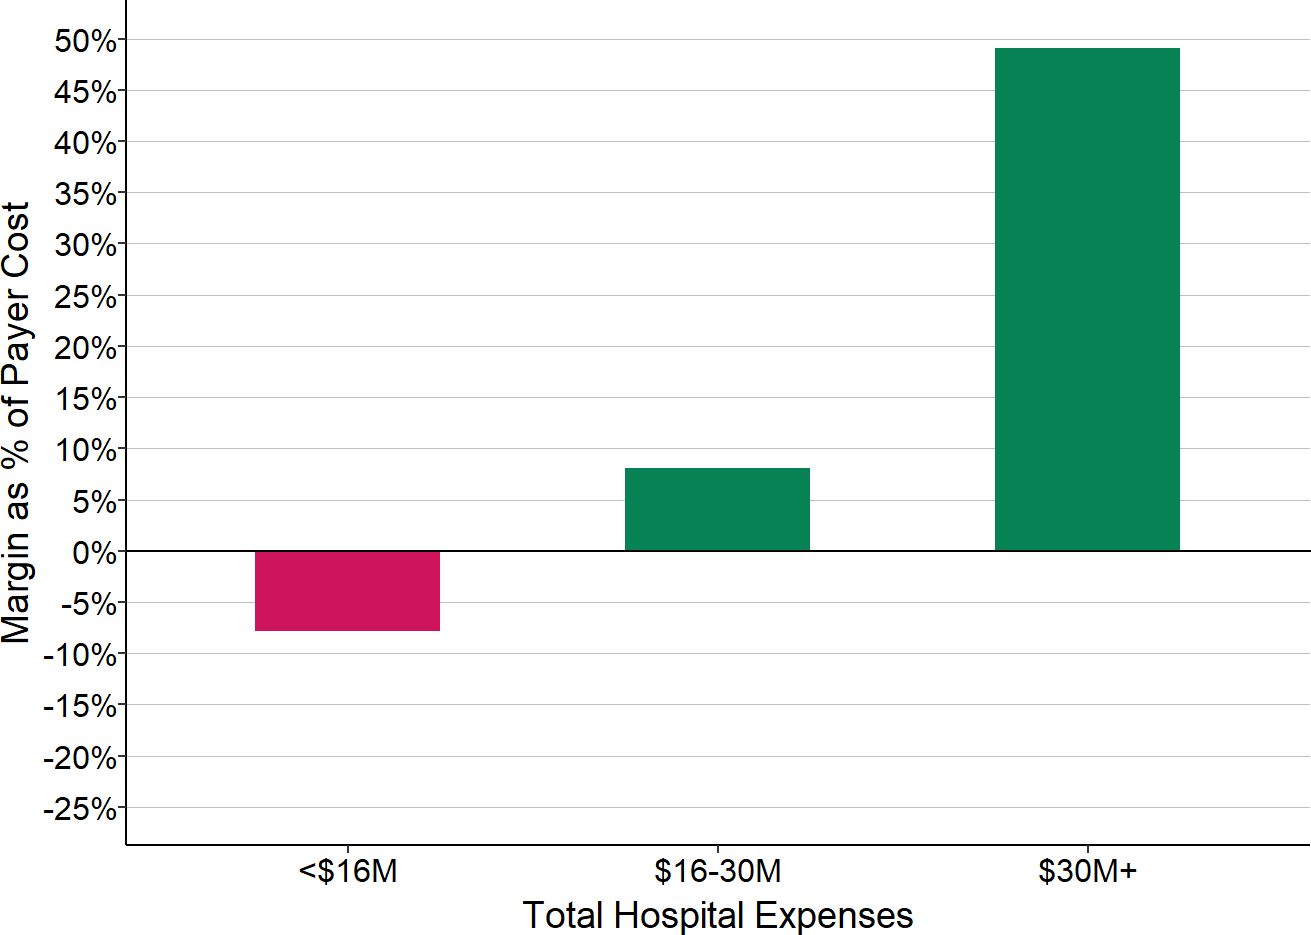
Median for 2015-17.
The California data allow private payers to be divided into three subgroups – Medicare Advantage, commercial insurance plans, and “other,” which includes self-pay patients who do not qualify for charity care as well as patients whose care is paid for by other types of programs (e.g., workers compensation). In addition, hospitals in California report the amount of bad debt for each category of payer.49
Figure 50
Margins from Private Payers Before Bad Debt
Rural Hospitals in California
Ignoring unknown labels:
• colour : "Payer"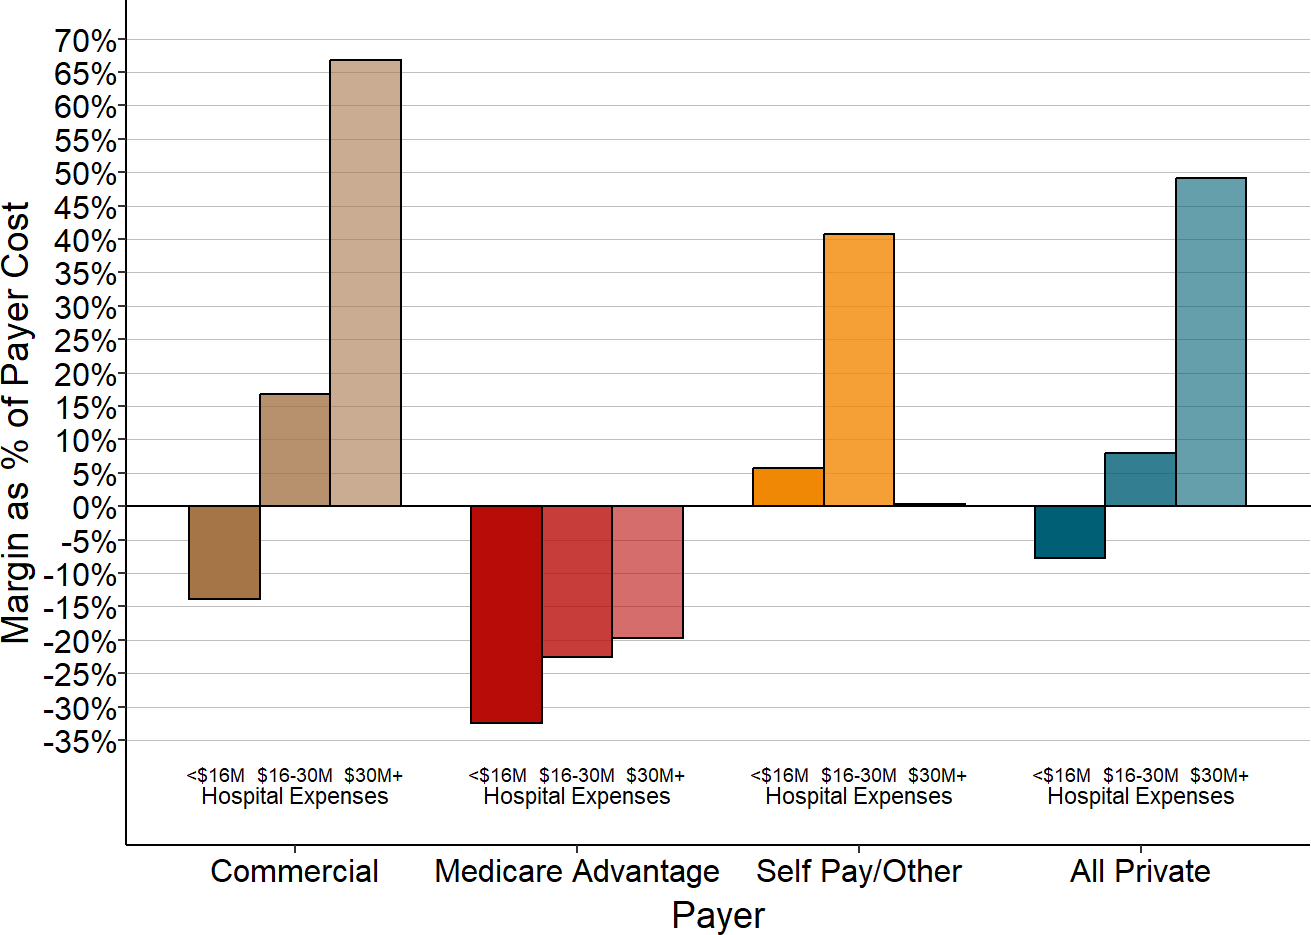
Median for 2015-17. Margins as % of cost assigned to private payer patients.
Figure 50 shows the percentage margins for each category of payer in small rural hospitals, i.e., the extent to which the amount the payer was obligated to pay the hospital exceeded or fell short of the cost of the services delivered to that payer’s patients. The margins are shown for (1) the smallest rural hospitals (those with less than $16 million in total expenses) where total private payer margins are generally negative, (2) the slightly larger hospitals (with $16-30 million in total expenses) where a small majority of hospitals make a profit on private payer patients, and (3) the largest rural hospitals, where most hospitals make profits on private-pay patients.
- The highest margins for the smallest hospitals are for self-pay/other patients. This is not surprising, because self-pay patients do not have the benefit of contractual discounts or fee schedules that the hospital has agreed to in advance with health insurance plans, and the hospital’s charges will be set high enough so they cover the costs of the services after the discounts are given to the health plans. However, these margins are misleading because they are the amounts the patients are obligated to pay, not the amounts they actually pay. As will be shown below, bad debt from self-pay patients eliminates all of this positive margin.
- The lowest margins are for Medicare Advantage patients. Most of the hospitals lose money on patients insured by Medicare Advantage plans because the plans pay significantly less than the costs of services for small rural hospitals in all size categories.
- Commercial insurance plans pay less than the cost of services at the smallest hospitals, whereas the payments are much more than the cost of services at the bigger hospitals.
Medicare Advantage Plans
Medicare Advantage plans are not required to pay hospitals the same amounts for services as the hospitals are paid for patient with Original Medicare. The losses on Medicare Advantage patients are not only bigger than the losses on commercial insurance patients at the smallest hospitals, but they are bigger than the losses those hospitals experience on Original Medicare patients. In fact, in California, small rural hospitals lost more money on services for Medicare Advantage patients than services to patients on Medicaid.
Figure 51
Margins for Medicare, Medicaid, and Medicare Advantage
Patients at California Rural Hospitals
Ignoring unknown labels:
• colour : "Payer"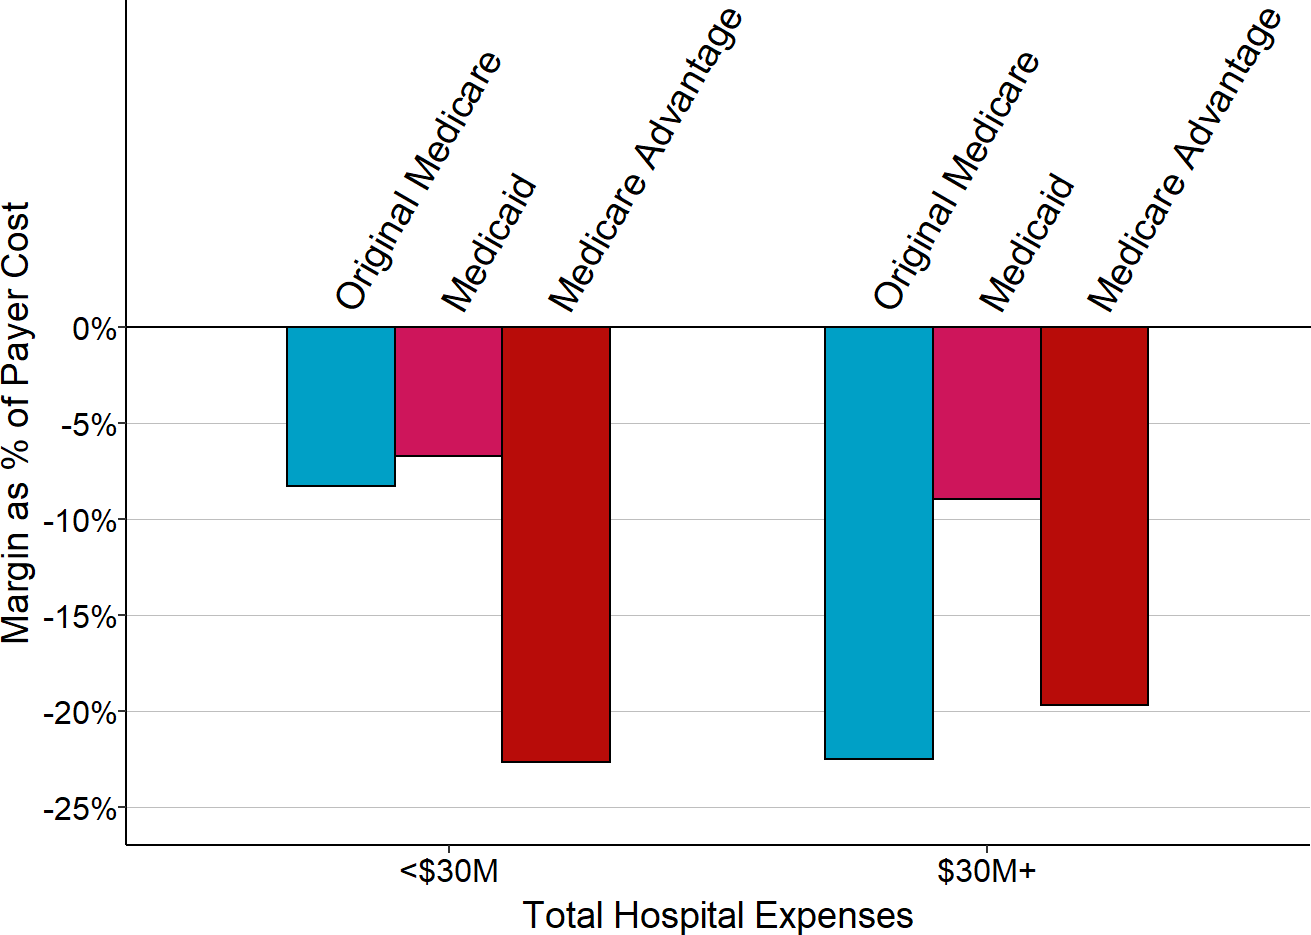
Median for 2015-17 Payer margin as % of cost assigned to that payer’s patients.
The impact of a particular payer on a hospital’s overall finances depends not only on the amount paid relative to costs for individual services, but also the proportion of the hospital’s total services that are paid for by that payer. Over 70% of the services delivered to private-payer patients in rural California hospitals were for patients with commercial insurance, so the profits or losses for those patients will have the biggest relative impact on the rural hospitals in California. Less than 20% of the private-pay patients are self-pay patients at the smallest hospitals, although this is a higher percentage than at larger hospitals.
Figure 52
Types of Private Payers
in California Rural Hospitals
Ignoring unknown labels:
• colour : "Payer"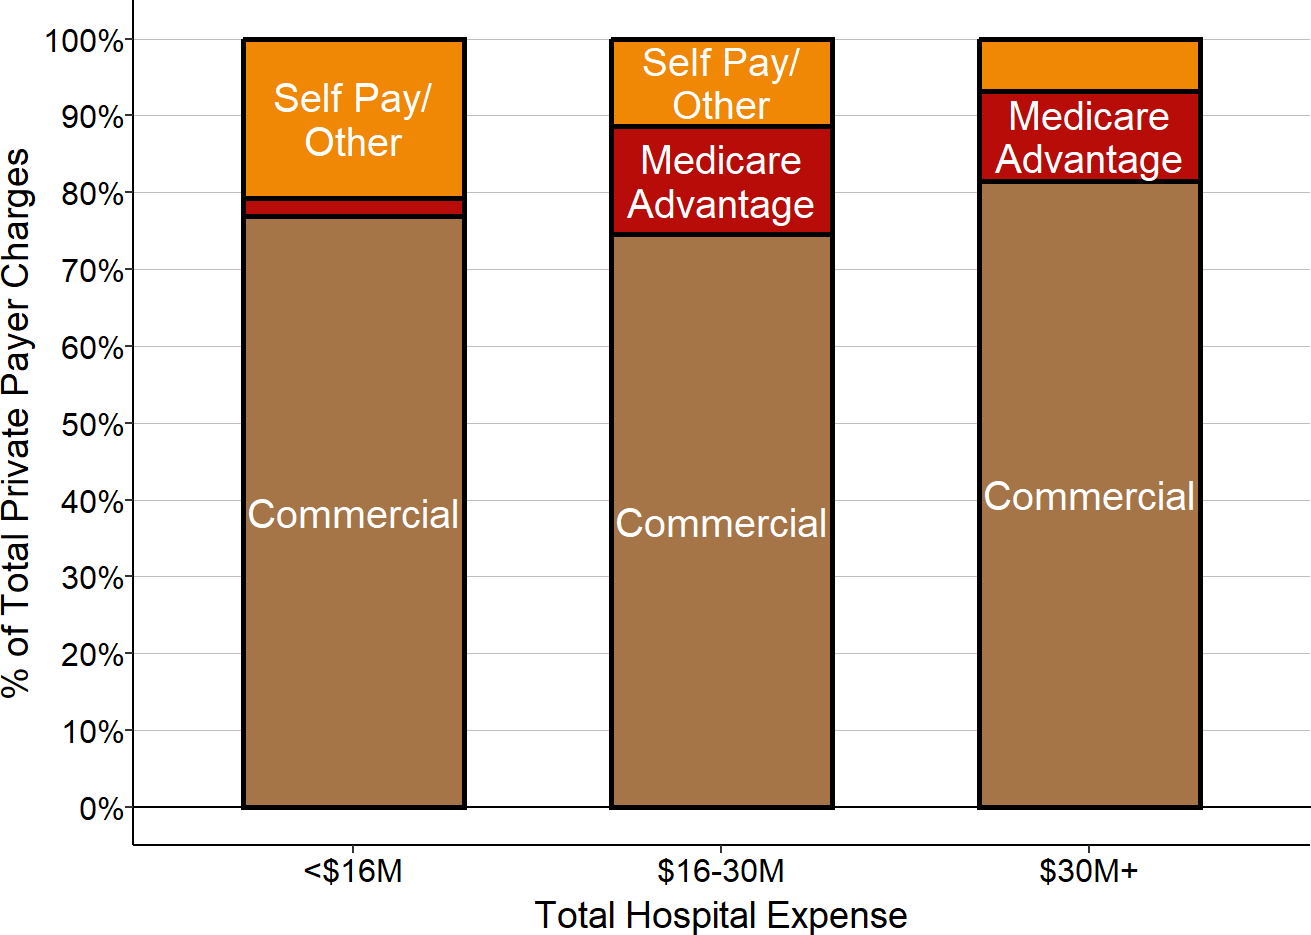
Payer percentage based on median charges for 2015-17.
Since Medicare Advantage plans pay less than commercial insurance plans, the smallest rural hospitals were fortunate to be located in counties with relatively low penetration of Medicare Advantage plans, at least in the years shown in the chart. The larger hospitals delivered 10%-20% of their services to Medicare Advantage patients, so they were more significantly affected by the losses on Medicare Advantage patients in these years. (However, these same hospitals made profits on commercially-insured patients that helped them offset the losses.)
Patient Bad Debt
Nearly half of the patient bad debt at the smallest rural hospitals is associated with patients who have insurance, i.e., it represents the patients’ failure to pay the cost-sharing they owe. It seems likely that this occurs disproportionately for patients whose health insurance plans require high deductibles, high copayments, and high co-insurance amounts, but this cannot be determined from the data. At larger hospitals, the majority of bad debt is associated with self-pay/other patients.
Figure 53
Sources of Non-Medicare Bad Debt
at California Rural Hospitals
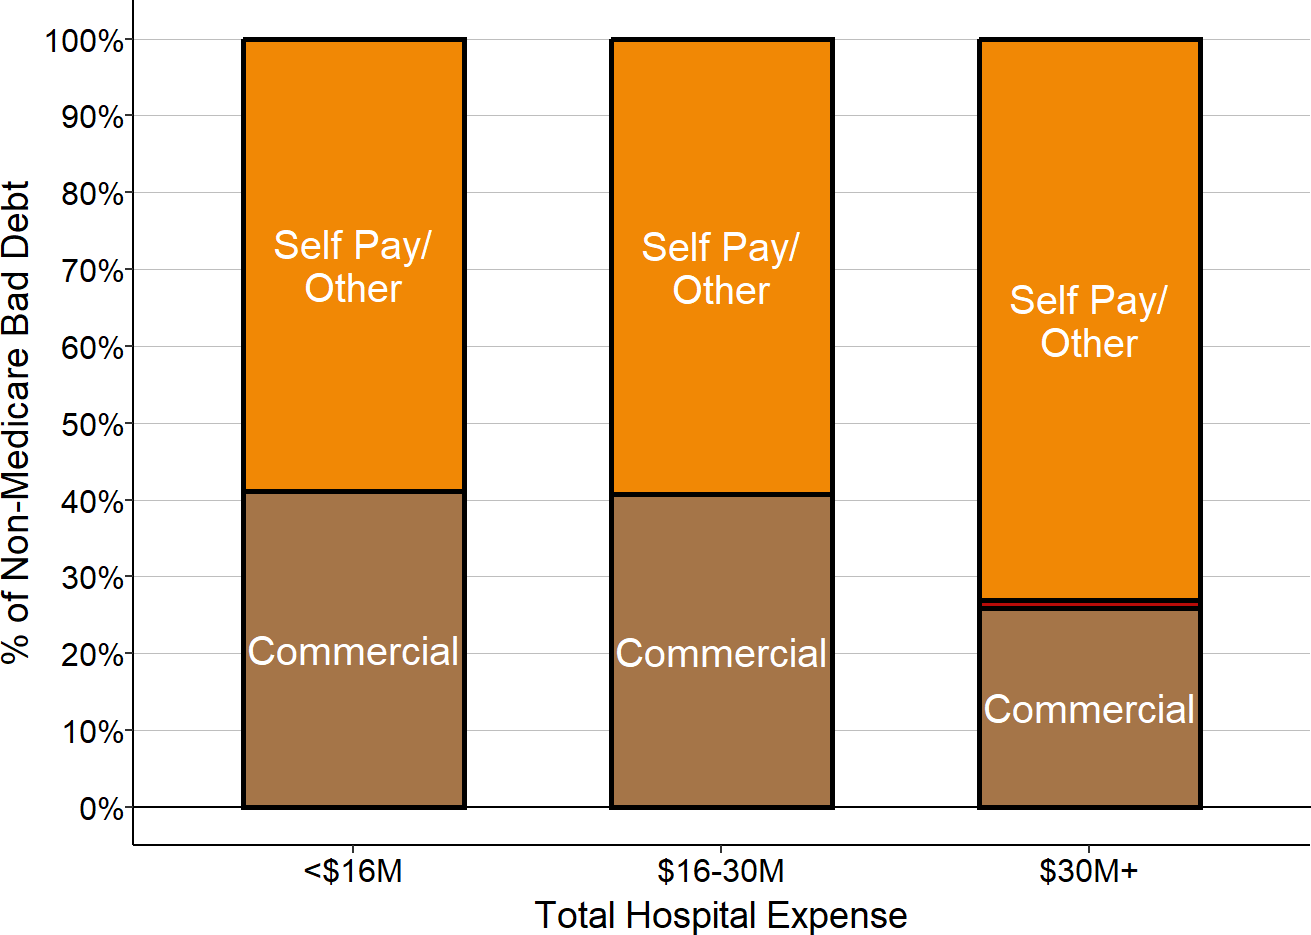
Median amounts for 2015-17.
The amount the smallest hospitals lose on bad debt for self-pay/other patients exceeds the profit the hospital would expect to generate if all patients paid the full amount charged, which results in a net loss for the hospitals on self-pay patients overall. The bad debt on commercially insured patients increases the loss on those patients. Overall, about half the total loss on all private pay patients is due to payment levels below costs, and the other half represents bad debt for both insured and self-pay patients.
Figure 54
Private Payer Margins Before and After Bad Debt
California Small Rural Hospitals
Ignoring unknown labels:
• colour : "Payer"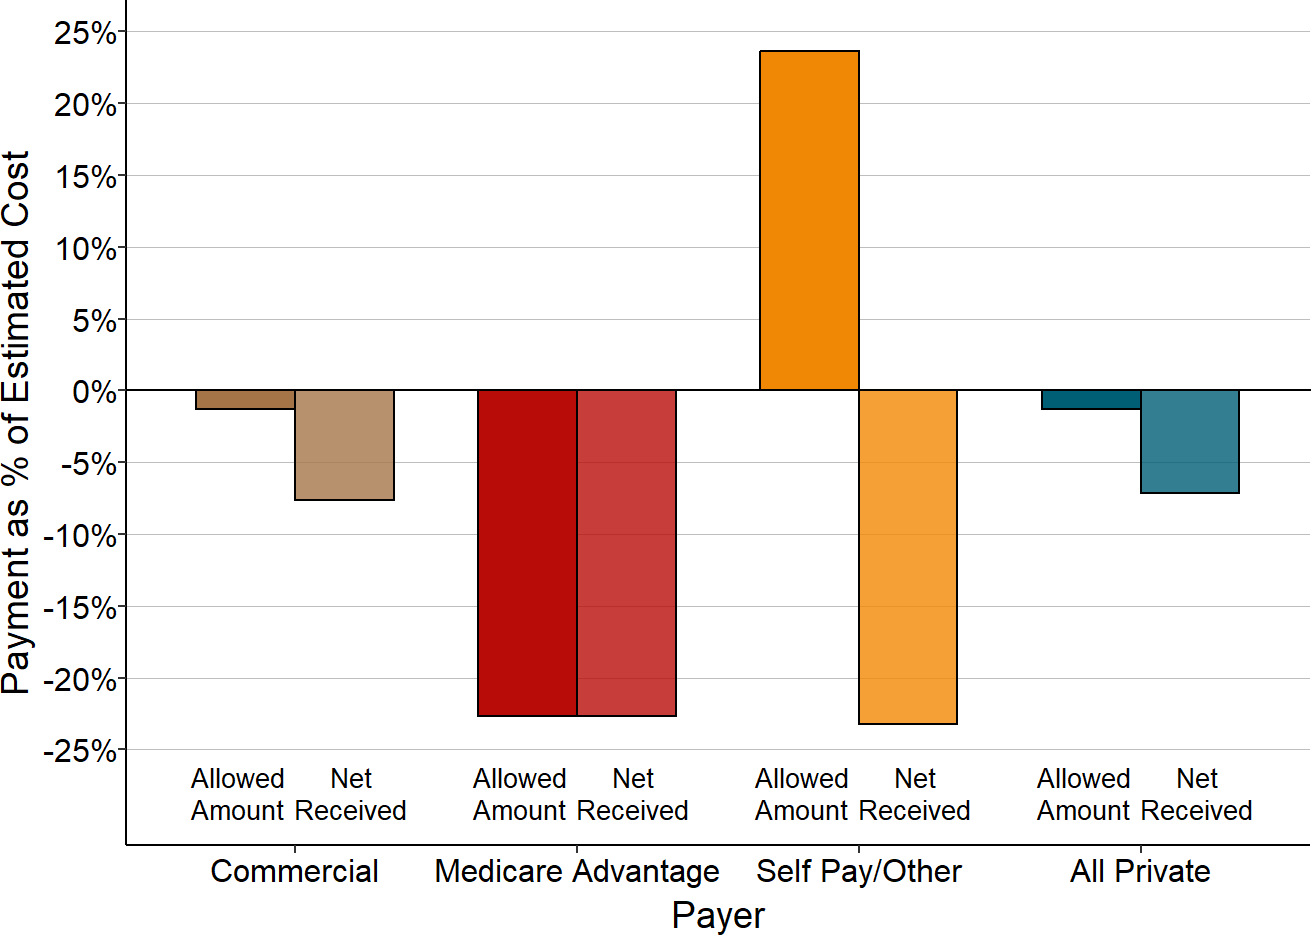
Median amounts for 2015-17 at rural hospitals with less than $30 million in expenses.
Overall Impact of Different Private Payers on Hospital Margins
The contribution that each payer makes to the hospital’s total margin (i.e., the profit or loss generated on that payer’s patients as a percentage of the hospital’s total expenses) reflects the combined effect of all three factors – payments relative to costs, bad debt, and the proportion of the hospital’s services paid for by each category of payer. Because commercially-insured patients represent the majority of private-pay patients at hospitals of all sizes, the overall private-pay contribution to the hospital’s overall margin is driven primarily by what the hospitals receive from commercially-insured patients. At the smallest hospitals, the losses on Medicare Advantage patients and self-pay patients exacerbate the large losses the hospitals experience on commercially-insured patients, whereas at the largest hospitals, the profits on commercially-insured patients are more than enough to offset the losses on Medicare Advantage and self-pay patients.
Figure 55
Private Payer Contributions to Total Margin
Net of Bad Debt at California Rural Hospitals
Ignoring unknown labels:
• colour : "Payer"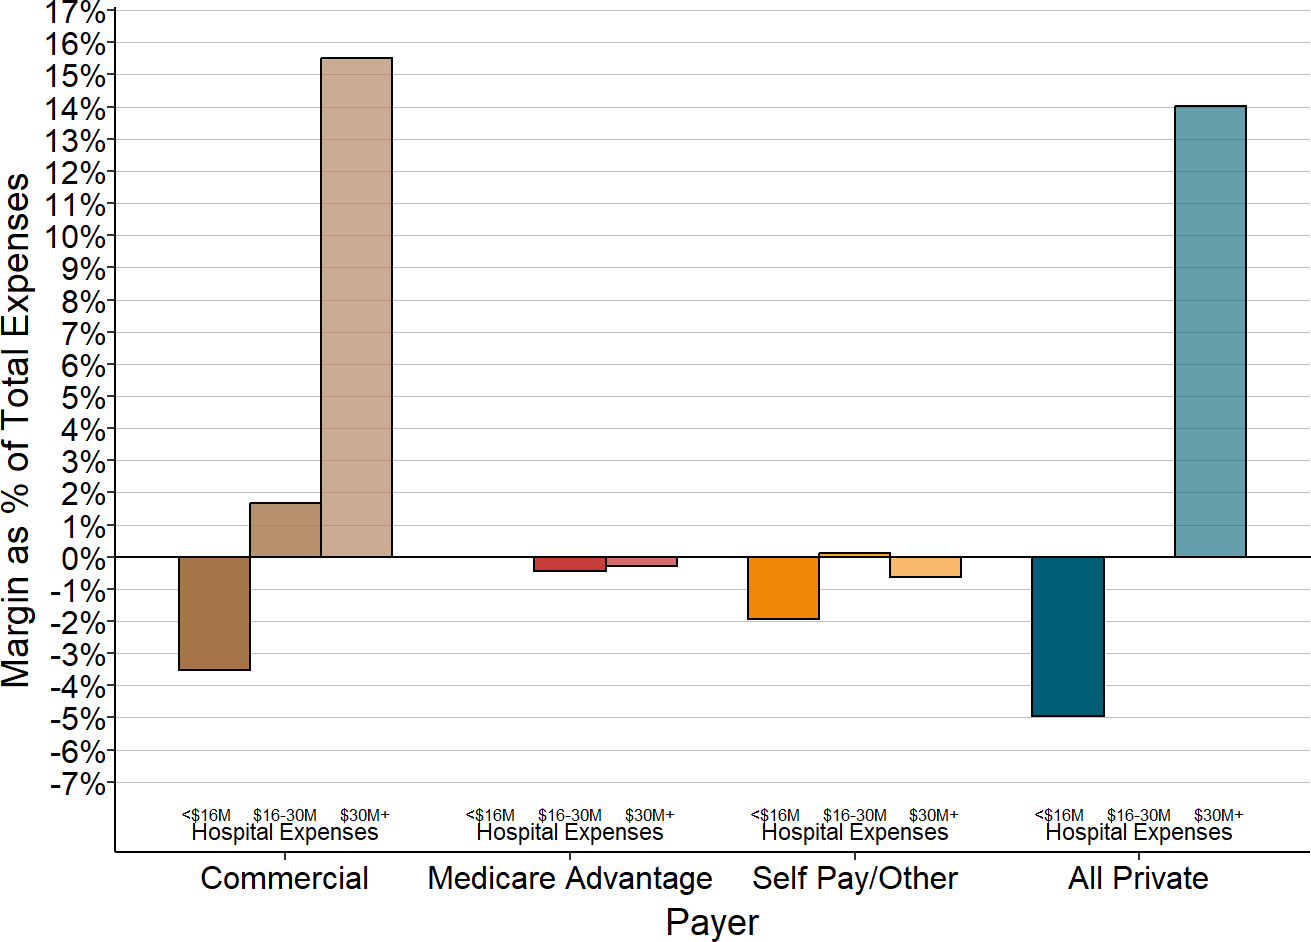
Median amounts for 2015-17.
Profits and Losses Based on Type of Private Insurance in Tennessee
In contrast to many states, private-pay patients have been profitable for the majority of very small rural hospitals in Tennessee. Larger rural hospitals make higher margins on private-pay patients than smaller hospitals in Tennessee, the same as most other states.50
Figure 56
Private Payer Margins
at Tennessee Rural Hospitals
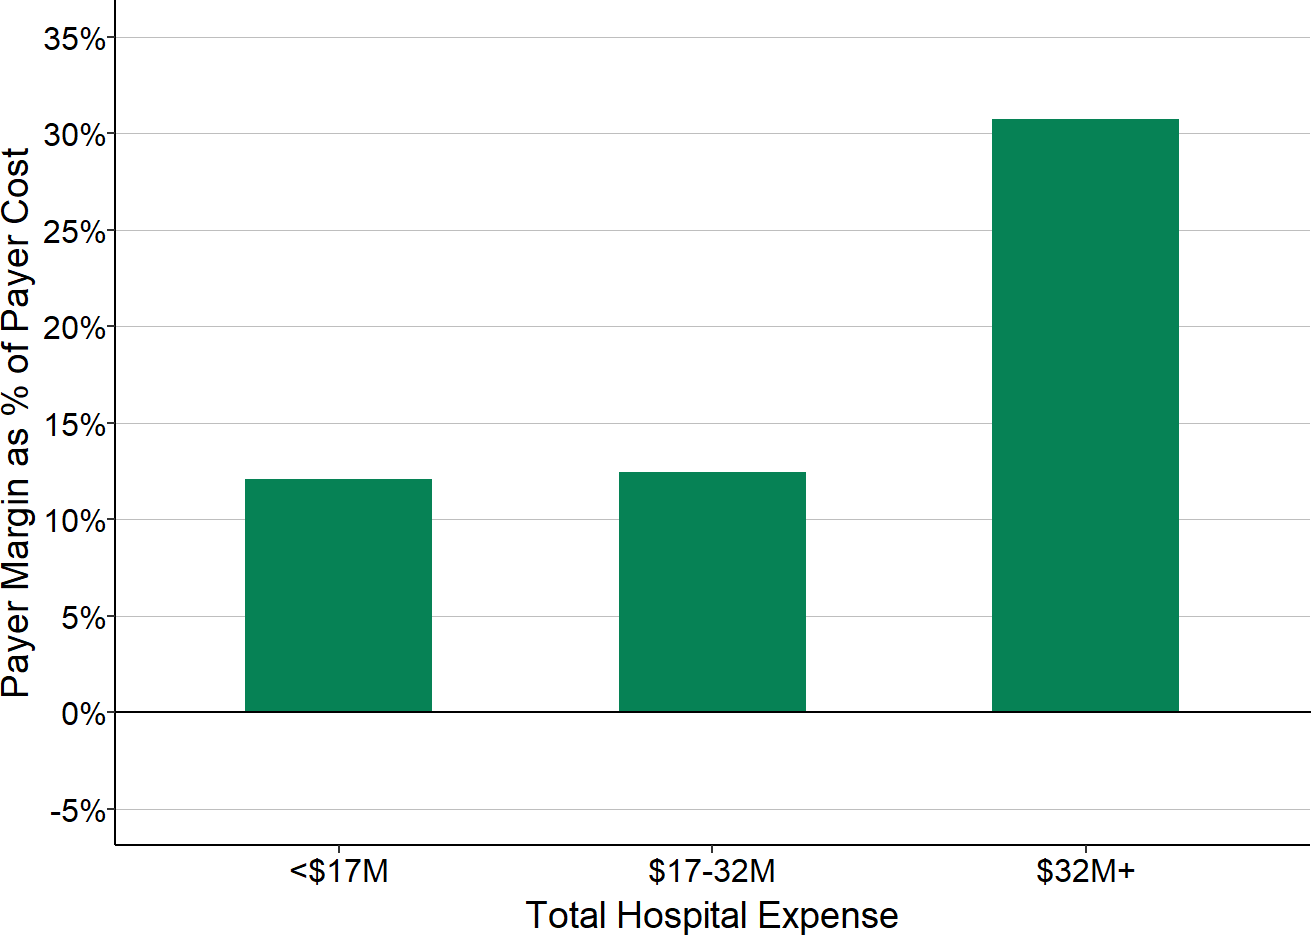
Median for 2017-18. Margins as % of cost assigned to private payer patients.
As in California, the detailed data in Tennessee51 allow private payers to be separated into commercial insurance plans and Medicare Advantage plans. In addition, the Tennessee data include separate categories for self-pay patients and several other types of payers. (Since the payer categories other than commercial insurance, Medicare Advantage, and self-pay patients represent only a small portion of charges and payments at the hospitals, they will be combined into a single “other” category here.)
Figure 57
Margins from Private Payers Before Bad Debt
at Tennessee Rural Hospitals
Ignoring unknown labels:
• colour : "Payer"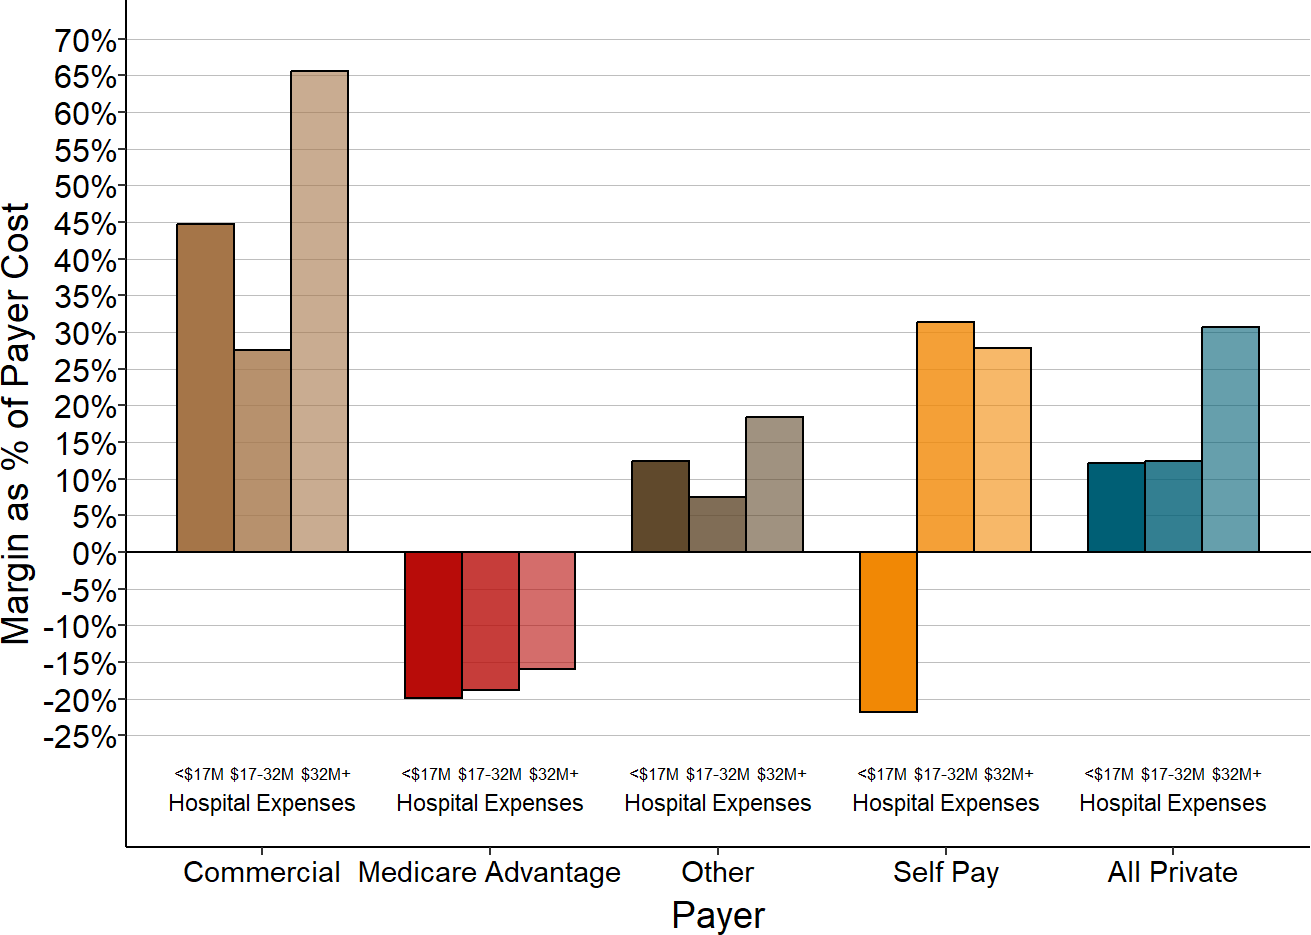
Median for 2017-18. Payer margin as % of cost assigned to that payer’s patients.
Figure 58
Margins for Medicare, Medicaid, and Medicare Advantage
Patients at Tennessee Rural Hospitals
Ignoring unknown labels:
• colour : "Payer"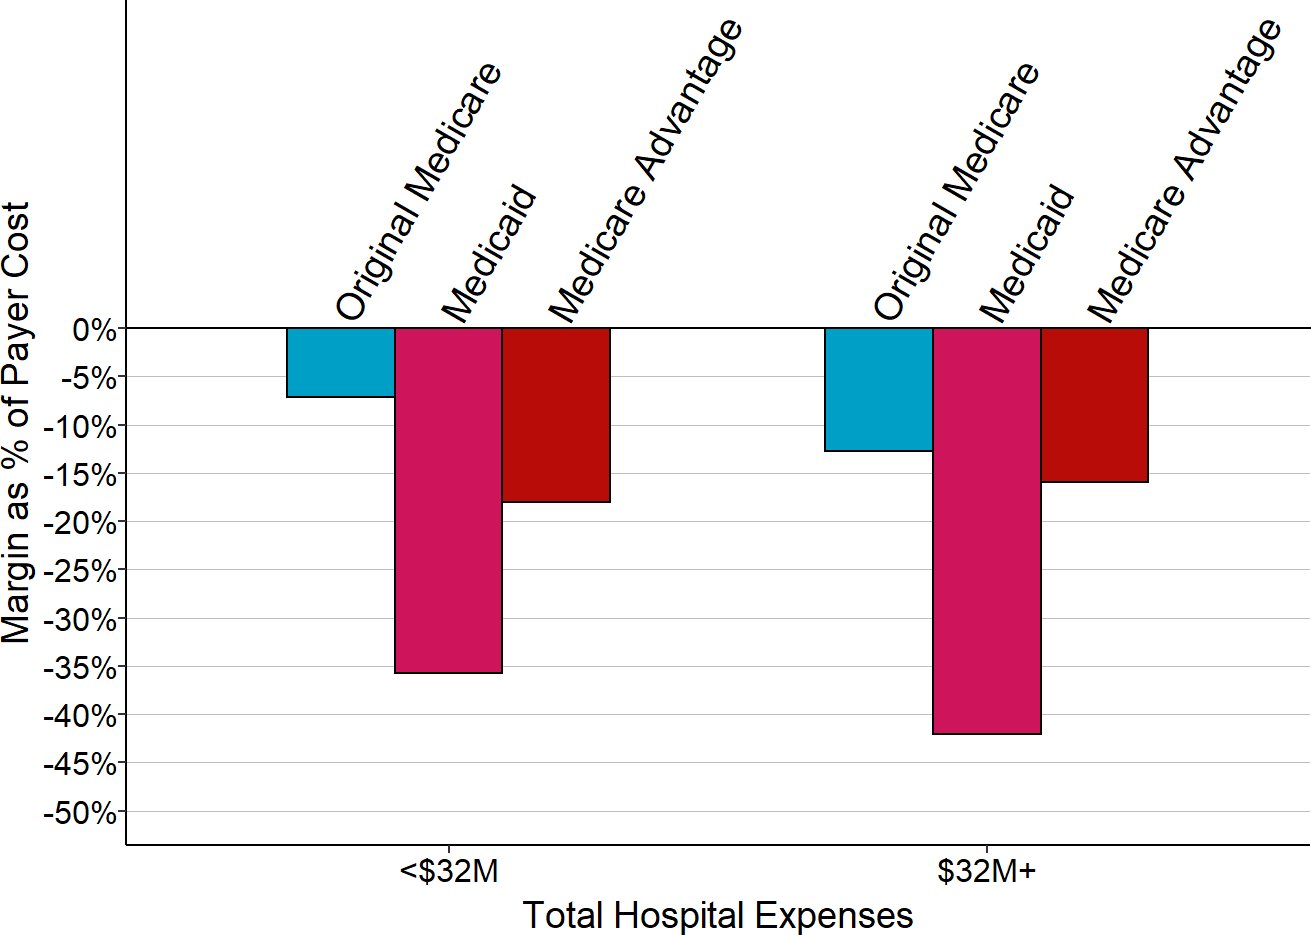
Median for 2017-18. Payer margin as % of cost assigned to that payer’s patients.
Figure 57 shows the percentage margins in Tennessee for each category of payer, similar to what is shown in Figure 50 for California. As in California, rural hospitals in Tennessee of all sizes lose money on Medicare Advantage patients, but the losses are even larger in Tennessee. Unlike California, the smallest rural hospitals in Tennessee make profits on their commercially insured patients.
Figure 58 compares the losses on Medicare Advantage patients in Tennessee to losses on Original Medicare beneficiaries and Medicaid patients, similar to what is shown in Figure 51 for California. The losses on Medicaid patients are larger in Tennessee than in California, but the losses on Medicare Advantage patients are similar. The losses on Medicare Advantage patients are larger than the losses on Original Medicare patients for both smaller and larger rural hospitals.
Hospitals receive payments from many different commercial insurance plans, and it is well known that different plans pay different amounts for the same service. Consequently, one cannot assume that every health insurance company and plan is contributing similarly to profits or losses at hospitals. In general, it is impossible to get information on what individual health plans pay for services. The Tennessee data provides a small amount of insight into the differences because most hospitals there report their charges and payments separately for patients insured by Blue Cross/Blue Shield (BCBS) plans vs. other commercial insurers. The data show that most rural hospitals in Tennessee make smaller profits on BCBS patients than on patients insured by other health plans.
Figure 59
Margins from Commercial Insurance Patients
at Tennessee Rural Hospitals
Ignoring unknown labels:
• colour : "Payer"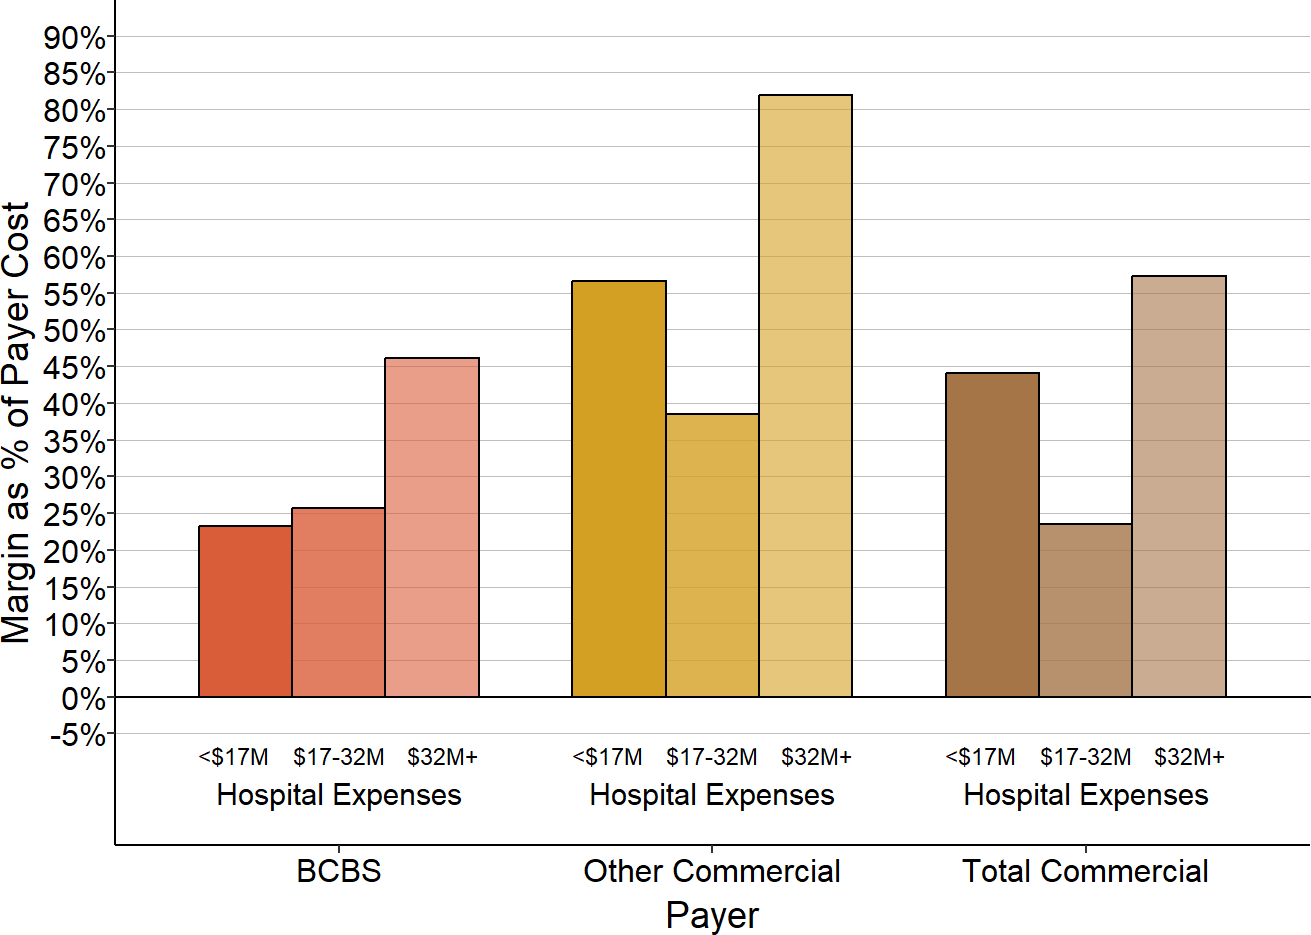
Median for 2017-18. Payer margin as % of cost assigned to that payer’s patients.
Similar to California, less than 20% of the private-pay category in Tennessee represents self-pay patients. However, a much larger share of Tennessee rural hospitals’ revenue came from Medicare Advantage plans than in California, which is problematic for the hospitals because of the losses on the Medicare Advantage patients.
Figure 60
Types of Private Payers
in Tennessee Rural Hospitals
Ignoring unknown labels:
• colour : "Payer"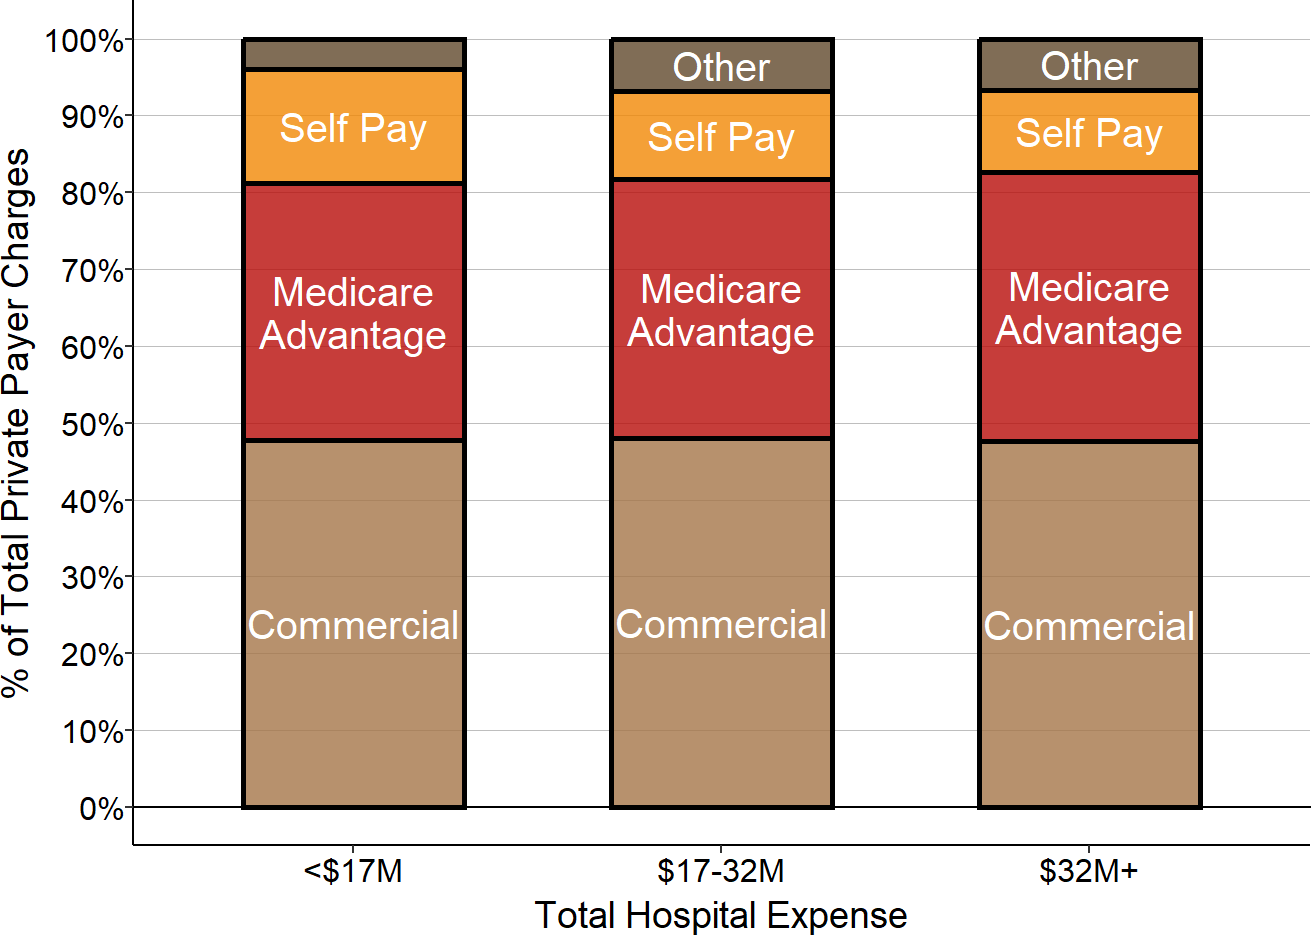
Payer percentage based on median charges for 2017-18.
A much smaller portion of patient bad debt is associated with commercially-insured patients in Tennessee than in California. This may reflect less burdensome cost-sharing requirements for patients in the commercial plans in Tennessee, but this cannot be determined from the hospital reports.
Figure 61
Sources of Non-Medicare Bad Debt
at Tennessee Rural Hospitals
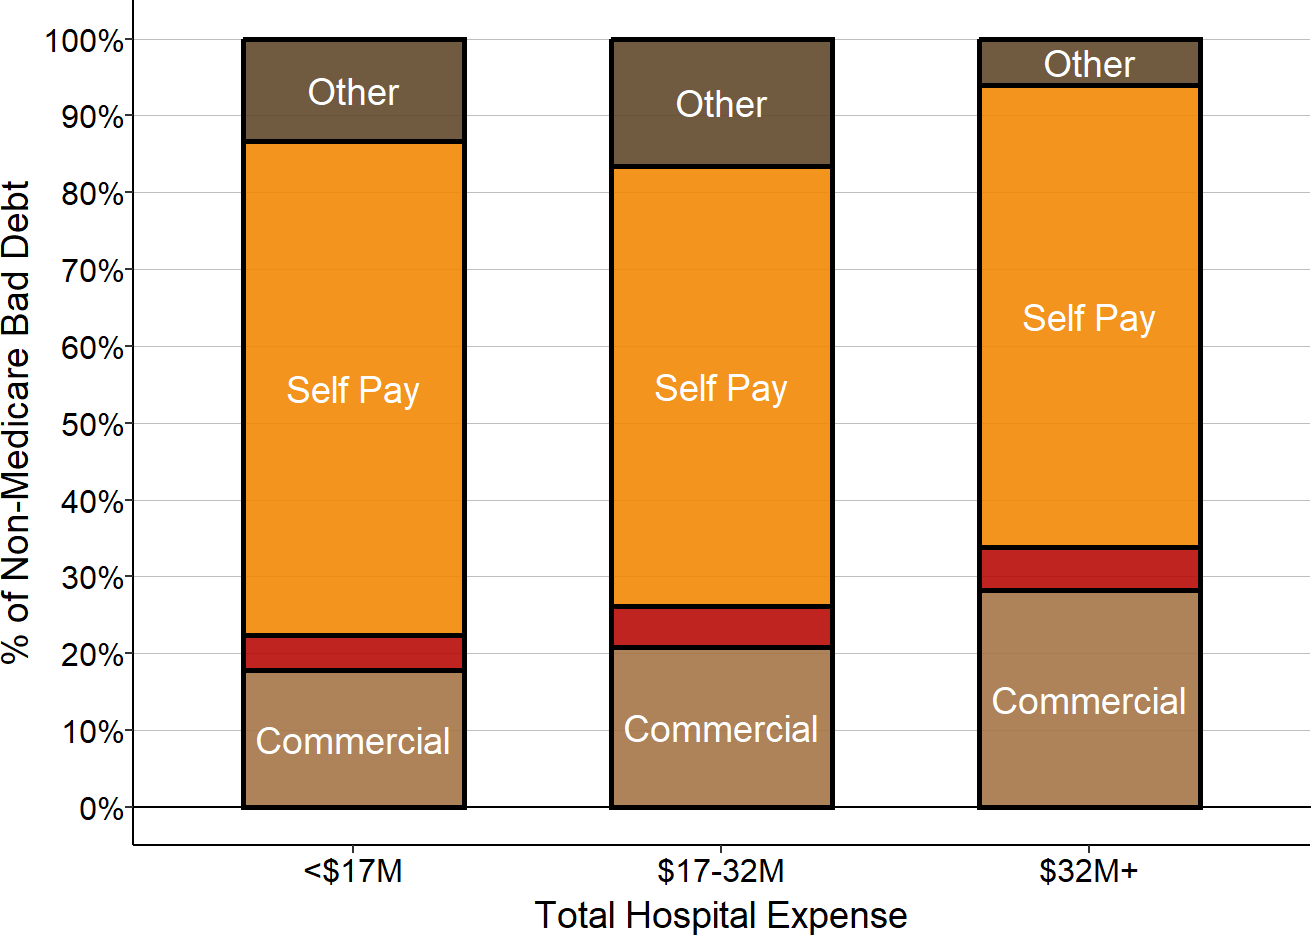
Median amounts for 2017-18.
Because commercially-insured patients represent the majority of private-pay patients at hospitals of all sizes, the overall contribution from private-pay patients to the hospital’s total margin is positive at most hospitals thanks to the profits the hospitals make on those patients. However, because of the large number of Medicare Advantage patients, the losses on those patients offset a significant portion of the profits on commercially-insured patients, and this, combined with losses on self-pay patients, can cause some hospitals to experience net losses on the overall private-pay category.
Figure 62
Private Payer Contributions to Hospital Margin
Net of Bad Debt, Tennessee Rural Hospitals
Ignoring unknown labels:
• colour : "Payer"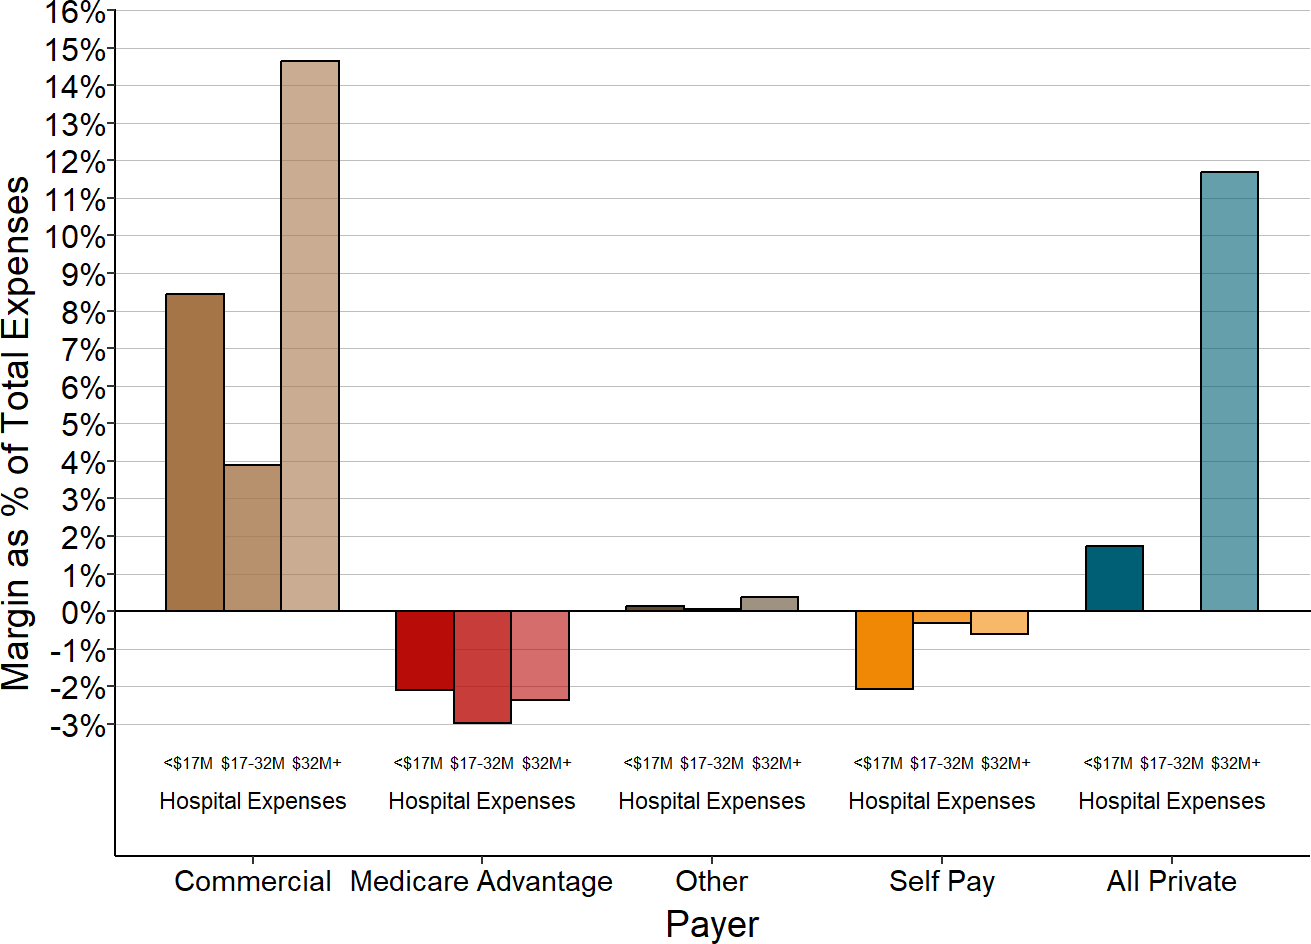
Median amounts for 2017-18.
Causes of Losses on Services to Patients with Private Insurance
There are several potential reasons why small rural hospitals have bigger losses (or smaller profits) on commercially-insured patients than larger hospitals:
Commercial insurance plans may be paying small rural hospitals less than the larger hospitals for the same services;
Commercial insurance plans could be paying both small and large hospitals the same amounts for services, but because it costs more to deliver services at small rural hospitals, the same amount of payment is less likely to cover costs at those hospitals; and/or
Commercial insurance plans may be refusing to pay at all for a higher proportion of services at the smaller hospitals than at the larger hospitals.
Similarly, small rural hospitals could have greater losses for Medicare beneficiaries who have Medicare Advantage plans than those with Original Medicare either because the Medicare Advantage plans pay less for the same services than the hospitals receive under Original Medicare, or because they deny claims altogether.
There is not sufficient detail in either Medicare or state hospital cost reports to determine which scenario is occurring. However, some insight can be gained from other studies of these issues.
Differences in Payment Amounts from Commercial Insurance Plans
It is usually impossible to find out what private insurance plans pay individual hospitals because of confidentiality restrictions in their contracts. However, as part of an employer-led transparency initiative, the RAND Corporation published data on the amounts commercial insurance plans (not including Medicare Advantage plans) paid for services to individual hospitals in 2015-17.52 The data only include a sufficient number of claims to allow analysis for a portion of the services delivered at a subset of hospitals in a subgroup of states53 so the results may not be representative of payment levels for all services for all hospitals, particularly very small rural hospitals, but the data do provide some insights into how commercial insurance payments differ between small rural hospitals and other hospitals.
The standardized commercial insurance payments54 for outpatient services were lower at the smallest rural hospitals than at larger rural hospitals, at least for the payers and hospitals included in the RAND data. The difference in payments was even larger for inpatient admissions at the smallest rural hospitals.
Figure 63
Standardized Commercial Insurance
Payments for Outpatient Services
at Rural Hospitals
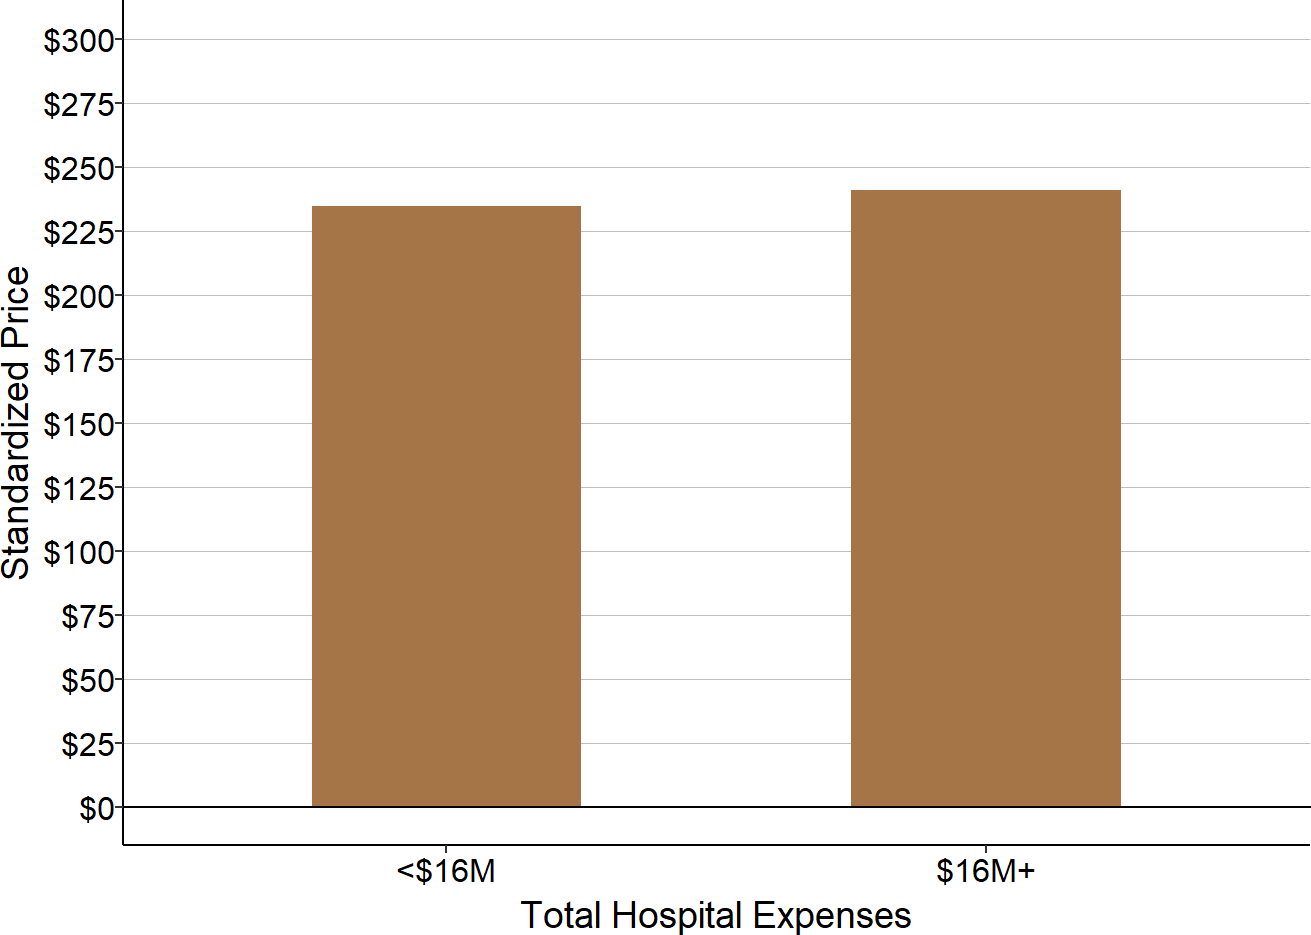
Median for 2015-17 at rural hospitals in RAND data.
Figure 64
Standardized Commercial Insurance
Payments for Inpatient Services
at Rural Hospitals
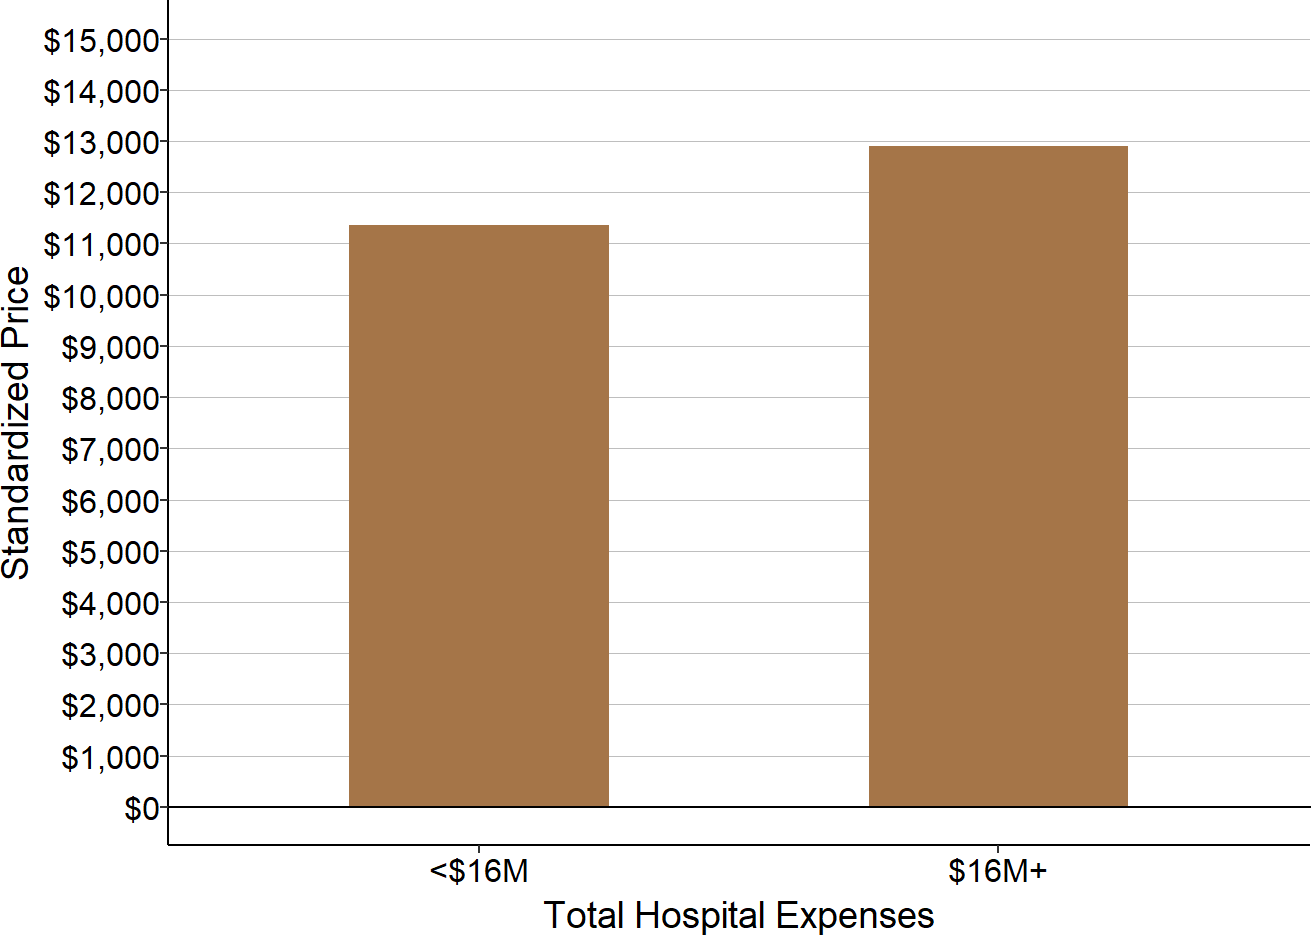
Median for 2015-17 at rural hospitals in RAND data.
Because it costs more to deliver services at smaller hospitals55, the lower payments at the smaller hospitals result in even bigger differences in the hospitals’ margins than the differences in payment amounts. The RAND report does not include data on the costs of the services that would enable directly calculating the margins for the patients in the dataset. However, the report does estimate the amount that the hospitals would have been paid by Medicare for the same types of services, and it compares the amounts of the commercial insurance payments and Medicare payment.56
At the smaller rural hospitals, private payments for inpatient admissions were lower than Medicare payments, whereas at the larger hospitals, the private payer payments for inpatient admissions were higher than the amount expected from Medicare for similar types of admissions.
Figure 65
Commercial Insurance Payments Relative to
Medicare for Inpatient Stays at Rural Hospitals
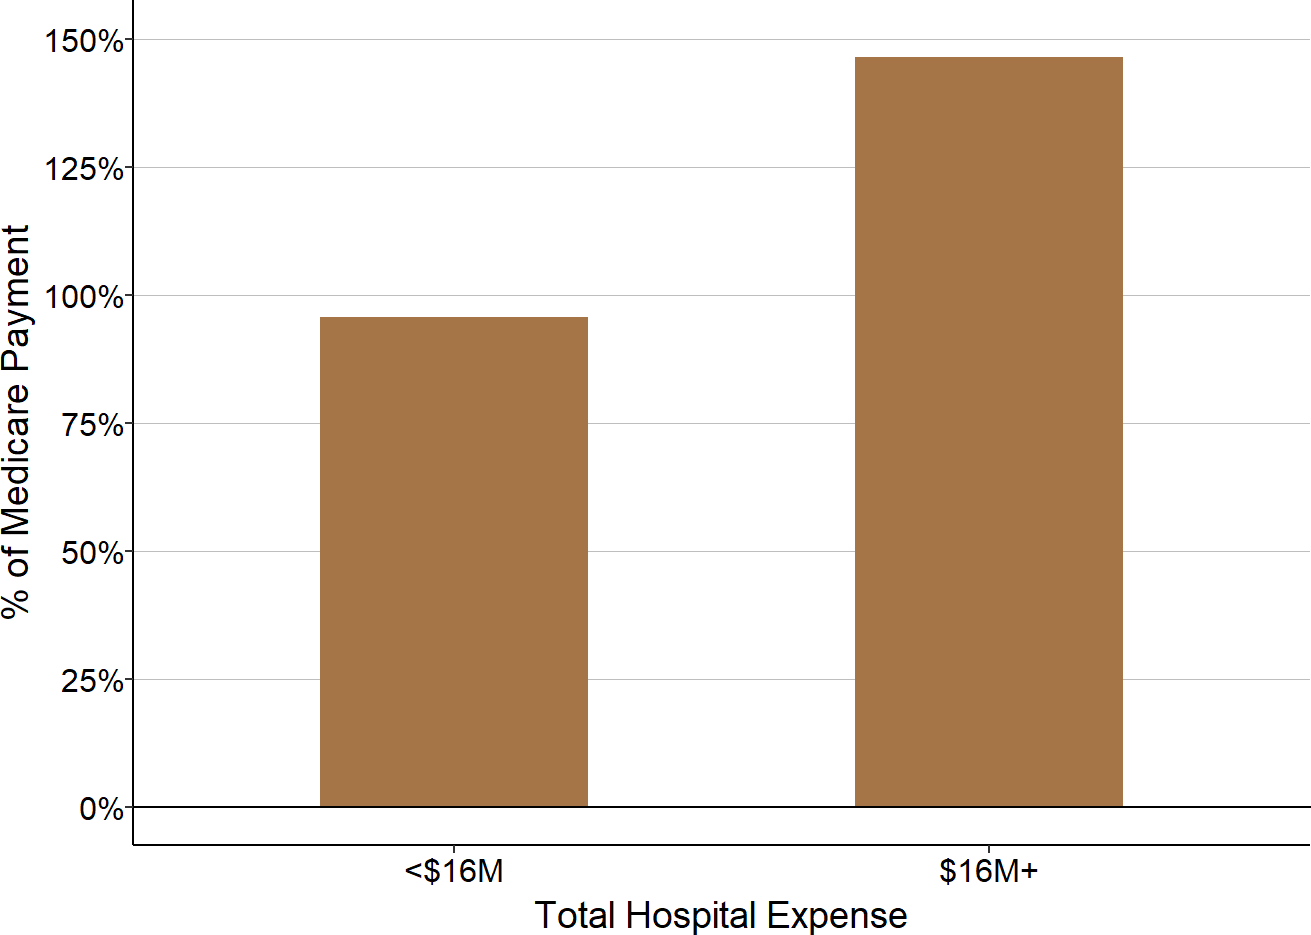
Median for 2015-17 at rural hospitals in RAND data.
Emergency department visits are the one service used frequently enough at every hospital to allow analysis of the variation of service-specific prices across hospitals and states. Commercial insurance payments for emergency department visits at the smallest rural hospitals vary significantly among the states for which data are available.
Figure 66
Standardized Commercial Insurance Payments
for ED Visits at Very Small Rural Hospitals
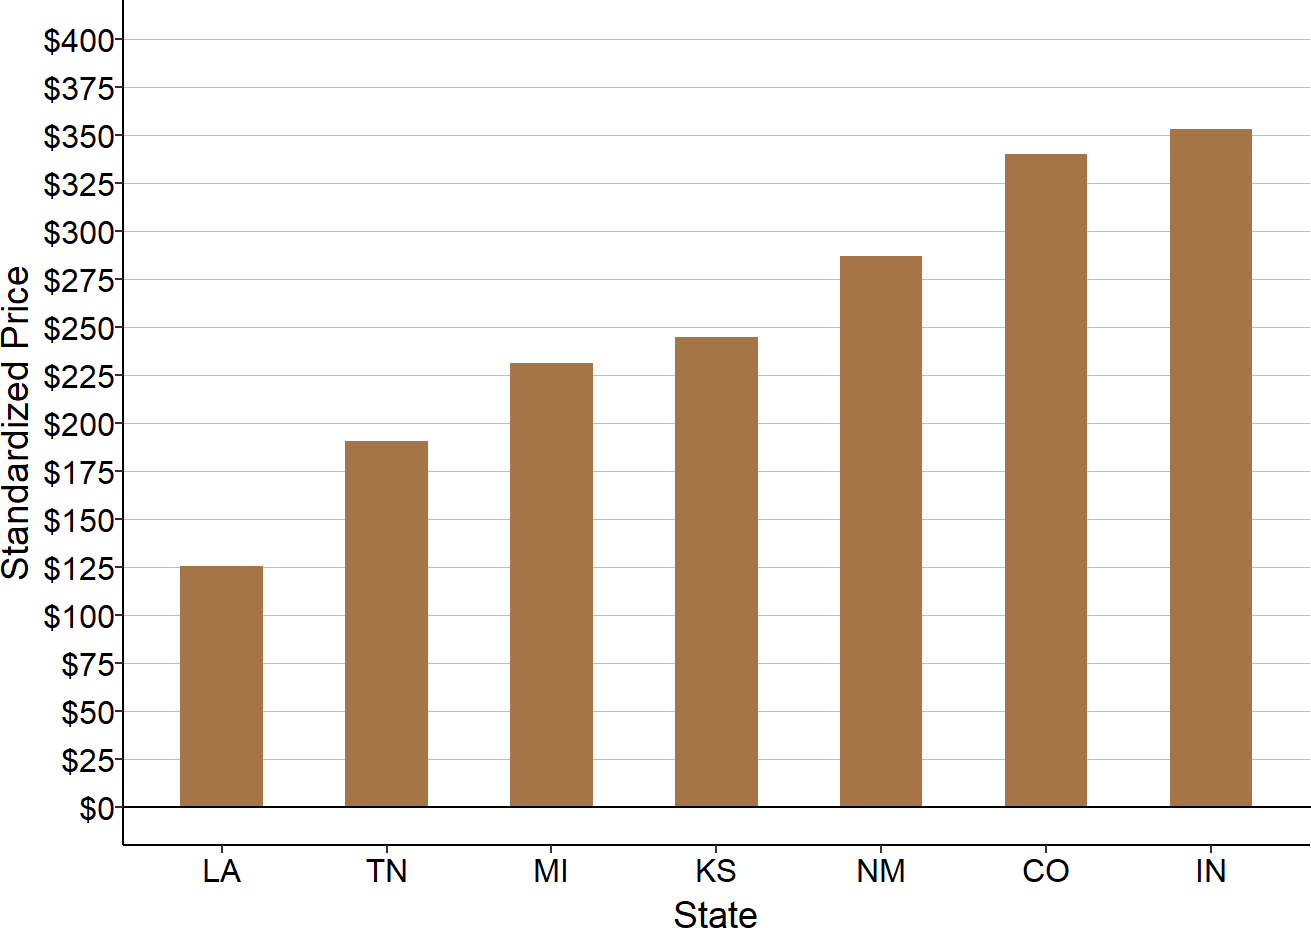
Median for 2015-17 at rural hospitals in the RAND data that had less than $16 million in annual expenses.
Denials and Delays in Payments by Commercial Insurance and Medicare Advantage
Most hospitals receive no payment at all for some of the services they deliver to patients with private insurance, even though the services were nominally supposed to be covered by the patient’s insurance plan, because the insurance company denies payment on the claims the hospital submits for the services. A portion of the losses on private insurance experienced by small rural hospitals are likely due to claims denials in addition to payments that are below the costs of individual services.
Multiple studies show that health insurance companies deny payment on a large portion of the claims submitted to them by hospitals, physicians, and other providers:
- A 2017 study by Change Healthcare found that 9% of charges submitted by hospitals in 2016 were initially denied.57 The study also reported that in cases where the hospital or patient appealed the denial, an average of 63% of the denials were overturned.
- A 2018 study by the Office of Inspector General at the U.S. Department of Health and Human Services found that Medicare Advantage plans denied over 36 million claims in 2016, representing 8% of the 448 million total claims submitted.58 In addition, the Medicare Advantage plans denied 1 million requests for services that required preauthorization, a denial rate of 4% on such requests. The study found that when denials of preauthorization or payment were appealed, 75% of the denials were overturned.
- A 2019 Kaiser Family Foundation study of individual insurance plans sold on the federal Health Insurance Marketplace (healthcare.gov) established under the Affordable Care Act found that over 41 million claims were denied in 2017, representing 18% of total claims submitted, with similar denial rates in previous years.59 The rates of claim denials varied significantly across the different health insurance companies analyzed, ranging from less than 1% to more than 40% of claims denied, and 45 of the 130 companies analyzed had denial rates over 20%. Moreover, the denial rates varied significantly across states, with denial rates over 20% in 13 states.60 The study also reported that the plans on the state-based marketplace in California (Covered California) denied 24% of the claims received.
Since nearly half of the services at the average small rural hospital are delivered to patients who have commercial insurance or a Medicare Advantage plan, denial rates of 8% or more could reduce the hospitals’ total margins by over 3%, in addition to any losses due to low payments for individual services. In fact, the Change Healthcare study estimated that the denied claims they analyzed represented 3.3% of net patient revenue at the hospitals. Hospitals whose patients are insured by plans with higher denial rates would have even higher losses.
However, claims denials do not just cause losses by reducing revenue. The process of resubmitting rejected claims and appealing claims denials requires an investment of time and resources by a hospital, which increases its expenses. The Change Healthcare study found that hospitals spent an average of $118 per claim on appeals, and the costs are likely higher for the smallest hospitals. The combination of both higher administrative costs to submit and appeal claims and the lower payments relative to the costs of services for claims that are paid likely contributes to higher losses and smaller profits for small rural hospitals.
In addition, health insurance plans will not pay for services delivered by a physician or other clinician unless that clinician is formally credentialed and enrolled as a provider with the health plan’s network. Small rural hospitals and their clinics experience significant turnover in their clinicians, and every time a new clinician is hired, that individual has to be enrolled with the health plan. Although the clinician can deliver services to patients as soon as they are credentialed by the hospital, the hospital or clinic cannot be paid until the clinician is also credentialed and enrolled with the health plan. Many small rural hospitals and small physician practices report delays of 2-4 months or even as long as 6-8 months in enrolling new providers with some payers.61 A long delay in enrollment translates into a long delay in receiving payments for the services delivered, and it can even result in no payment at all if enrollment is not completed within the timeframe allowed for submitting a claim for payment or if the health plan simply refuses to pay for the claim.62
Reducing Financial Problems That Cause Closures
The Multiple Causes of Rural Hospital Financial Problems
The analyses presented above demonstrate that there is no single reason why most of the small rural hospitals in the country are losing money. Some hospitals lose large amounts on services to patients with private insurance while others do not, and not every hospital loses money on the services it delivers to patients on Medicaid. Some hospitals have many more uninsured and underinsured patients than others do. Some hospitals receive a sufficient amount of revenue from other sources to offset losses on patient services, but others do not.
Moreover, the financial problems facing small rural hospitals are more serious than what is often reported based on more superficial analyses. Many small rural hospitals that have positive total margins are losing significant amounts of money delivering patient services. They only remain in the black because they receive other sources of revenue, such as local tax levies and special state grants, that are large enough to offset the losses on patient services. It is not clear whether these other sources of revenue will be able to continue at the same levels in the future, particularly with the higher levels of unemployment in local communities and reductions in state and local government revenues that have occurred due to the coronavirus pandemic. Moreover, some of the current funding programs are explicitly time-limited, and if they are not extended, many hospitals could experience financial losses that would threaten their continued viability.63
Financial Problems Are Growing Worse
The financial problems facing small rural hospitals were temporarily reduced by the one-time financial aid provided during the pandemic, but the problems were ot eliminated. In fact, losses on patient services were greater in 2021-2022 than they were prior to the pandemic due to the higher costs that all hospitals, particularly small rural hospitals, began experiencing. The other sources of funding that many hospitals used to offset losses on patient services in the past (such as local tax revenues) may not be sufficient to offset higher losses, causing more rural hospitals to have negative total margins in the future.
No One Payer Can Solve Rural Hospital Financial Problems
Since no one category of payer is responsible for the losses on patient services, changes made by any one payer would only be able to solve a portion of the problem.
Figure 67
Reduction in Number of Small Rural Hospitals With Negative Margins If Payer-Specific Losses Were Eliminated
| Payer or Source of Loss | % of Small Rural Hospitals Moving From Negative to Positive Margin If Payer Paid Full Cost |
|---|---|
| Private Payers | 24.1% |
| Patient Bad Debt | 13.7% |
| Medicaid | 8.7% |
| Uninsured Charity Care | 5.1% |
| Medicare | 2.4% |
Assumes each hospital with a negative margin from that payer would receive sufficent additional revenue to offset that payer-specific loss. Margins are based on hospitals that had less than $45 million in expenses.
The table shows the percentage of small rural hospitals that would have changed from a financial loss to a positive margin on patient services in 2024 if losses for one specific type of payer had been eliminated. Clearly, while the impact differs significantly by payer, changes made for only one category of payer would only help a fraction of hospitals:
- Medicare. Even if Medicare had paid all small rural hospitals at least 100% of their costs for Original Medicare patients, the number of hospitals losing money on patient services would only have been reduced by 2-3%.
- Medicaid. Although hospitals experience larger losses on individual services delivered to Medicaid patients than Medicare patients, they deliver fewer services to Medicaid patients. As a result, even if Medicaid programs had paid all small rural hospitals at least 100% of their costs for Medicaid patients, the number of hospitals experiencing overall losses would only have decreased by 14%.
- Charity Care. If hospitals had received full payments for the services they delivered to uninsured charity care patients, there would only have been a 5% reduction in the number of hospitals with financial losses.
- Private Payers. Because of the large losses small rural hospitals experience on private-pay patients and the large proportion of patients who have private insurance, the biggest impact would come from changes in private insurance payments. If all private payers had paid small rural hospitals at least 100% of their costs for services, it would have reduced the number of hospitals experiencing losses by 20%. However, this impact would only occur if every private payer had paid adequately, including the many different commercial insurance and Medicare Advantage plans.
- Bad Debt. The impact of reducing bad debt losses would be smaller than the impact of eliminating losses on the payments from private payers, but similar to the impact of increasing Medicaid payment amounts. As discussed earlier, bad debt represents a combination of (1) patients who do not have insurance and do not meet charity care standards and (2) patients who have insurance but do not pay their cost-sharing obligations, so eliminating losses in this category requires both expanding insurance coverage and reducing the cost-sharing amounts required in private insurance plans. Large hospitals can offset bad debt losses using the margins generated on higher payments from patients with private insurance, but most small rural hospitals cannot do that.
Moreover, because there are significant differences across states in the causes of losses at small rural hospitals, changes made by any one type of payer would benefit small rural hospitals in some states far more than others. For example, about half of the small rural hospitals in both Alabama and Tennessee are losing money overall. However, even though the states are adjacent to each other, the causes of the losses were completely different. Low payments for private-pay patients (both low allowed amounts and high unpaid patient obligations) were the biggest cause of losses in Alabama, whereas losses on Medicaid and the uninsured were the biggest factor in Tennessee. As a result, increasing Medicaid payments would benefit hospitals in Tennessee far more than those in Alabama, whereas increases in private insurance payments or reductions in patient cost-sharing amounts would likely be essential to solving the financial problems for the hospitals in Alabama.
Figure 68
Contributions to Total Margin by Each Payer in Small Rural Hospitals in Alabama and Tennessee
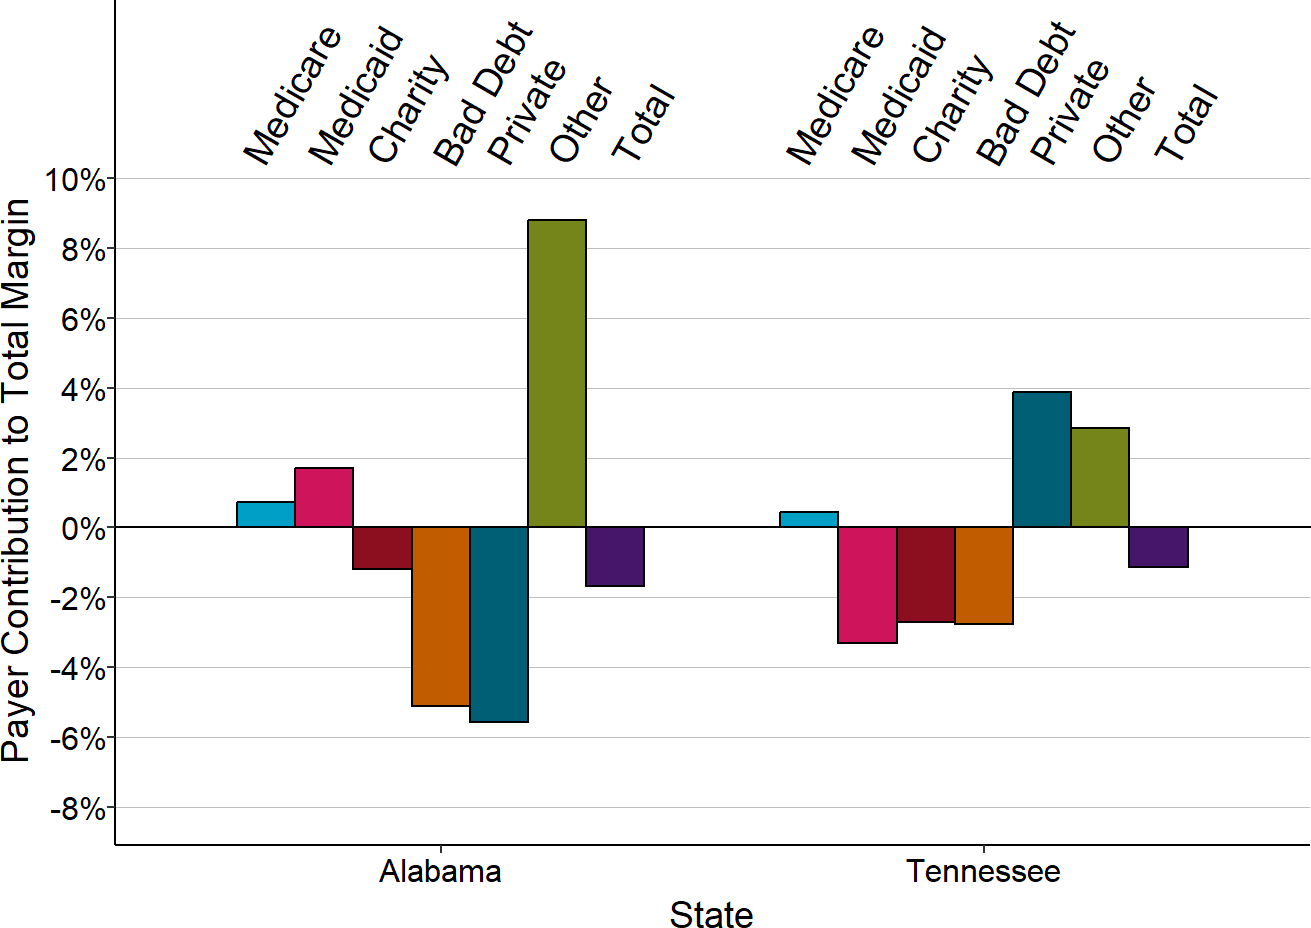
Median of three most recent years available for rural hospitals located in each state that had less than $45 million in expenses.
Because so many small rural hospitals experience losses on the payments they receive from most payers, it is impossible to eliminate losses for the majority of hospitals without making changes in the payments from both private and public insurers.
The Impact of Expanding Insurance Coverage
Although every hospital loses some money on services delivered to patients who do not have health insurance, the losses are greater for hospitals in communities where more of the population is uninsured. Although there are many reasons why people do not have insurance, one important factor affecting insurance coverage is the state’s eligibility requirements for Medicaid.
Many have advocated for expanding Medicaid eligibility in states that have not done so as a way to help small rural hospitals. However, only a subset of the uninsured patients at rural hospitals in non-expansion states would likely qualify for Medicaid if it were expanded. As shown in Figure 43, in states that did expand Medicaid, the losses on uninsured charity care patients at small rural hospitals were reduced but not eliminated.
It also costs much more to expand Medicaid in a state than it would cost to pay directly for the losses at rural hospitals on their services to uninsured patients. When a state expands Medicaid, it provides coverage for individuals living in urban areas as well as rural areas, and it provides coverage for many types of healthcare services beyond those delivered by rural hospitals. If the high cost of expansion forces a state Medicaid program to reduce the amount it pays for services or to increase payment amounts each year by less than the amount that costs increase, losses at rural hospitals may increase, not decrease. Figure 43 showed that in expansion states, increases in the losses on services delivered to patients with Medicaid offset some of the benefit of the expanded coverage for small rural hospitals.
Figure 67 shows that even if every patient had health insurance coverage, it would eliminate financial losses at only a small percentage of hospitals.64 Consequently, while health insurance is desirable for many reasons and expanding coverage should be part of any comprehensive strategy for improving access to healthcare in rural areas, higher payments from existing payers would be more likely to reduce financial problems and prevent closures for the majority of small rural hospitals.
The Need for Payers to Pay Rural Hospitals Adequately for Services
The analyses above clearly show that the only way to successfully eliminate financial losses and prevent closures at most rural hospitals is for Medicare, Medicaid, and private insurance plans to pay rural hospitals adequately to deliver the services patients need. For most small rural hospitals, the biggest shortfalls in payments are from private insurance plans, and the second largest shortfalls are in Medicaid, but as noted earlier, the relative contributions of private payers vs. Medicaid varies significantly across states. Although Medicare pays less than the cost of services at most small rural hospitals, the magnitude of the shortfall is smaller than for other payers because so many small rural hospitals are designated as Critical Access Hospitals and qualify for cost-based payment from Medicare. (Critical Access Hospitals also lose money on Medicare patients, but the losses are smaller than for other hospitals of similar size.)
Some rural communities could reduce financial losses at their hospital simply by making different choices about their health insurance plans.
- For example, in communities where Medicare Advantage plans are paying low amounts for services and denying large numbers of claims, the Medicare beneficiaries who have chosen those plans may not be aware that low payments for services from the plans are helping to force the local hospital out of business. In these situations, if Medicare beneficiaries living in the community choose a different Medicare Advantage plan or choose Original Medicare instead of a Medicare Advantage plan, they could help the hospital reduce its losses.
- Similarly, employers in the community may not be aware that the commercial insurance plan they have chosen for their employees pays less than what it costs to deliver the services their employees need, or that the plan is denying or delaying payments for needed services. If the employers chose a different plan that paid adequately for services, it could avoid closure of the community hospital. However, this can only be successful if there is at least one plan available that pays adequately for services.
What is “adequate payment?” Answering that question requires understanding how much it costs to deliver services at a small, rural hospital, which is addressed in the section on the Cost of Rural Services.
Footnotes
A “rural” hospital is a hospital located in an area that is classified as rural by the Health Resources and Services Administration. Based on the revised definition established in 2021, an area is rural if either (1) it is in a county classified as “non-metropolitan” by the U.S. Office of Management and Budget (OMB); or (2) it is in a county classified as “metropolitan” and is either (a) in a census tract with a Rural-Urban Commuting Area (RUCA) Code of 4.0 or higher, or (b) in a census tract with a RUCA Code of 2 or 3 that is at least 400 square miles in area and has a population density of 35 persons per square mile or less, or (3) it is in a county classified as “metropolitan” that does not contain any urbanized area (which is defined by the U.S. Census Bureau as an incorporated place with 2,500 or more residents). Other federal agencies, including the Centers for Medicare and Medicaid Services, only consider a hospital to be “rural” if it is located in a non-metropolitan county, and exclude hospitals located in rural portions of metropolitan areas. This is why many reports with statistics on hospitals indicate that there only about 1,800 rural hospitals in the country.↩︎
The “rural hospitals that closed” are those that appear on the list maintained by the Cecil G. Sheps Center for Health Services Research at the University of North Carolina.↩︎
Data on costs and revenues for hospitals are from the Hospital Cost Reports that hospitals are required to submit to the Centers for Medicare and Medicaid Services. (U.S. Department of Health and Human Services, Center for Medicare and Medicaid Services. Healthcare Cost Report Information System.)↩︎
The “margin” is calculated here by subtracting the hospital’s expenses from its revenues and then dividing the difference by the expenses (i.e., Margin = [Revenues – Expenses]/Expenses), rather than the standard approach of using revenues in the denominator. When revenues and expenses differ by small amounts, the two approaches lead to similar results. For example, if a hospital has $20 million in expenses and $19 million in revenues, the standard approach would calculate a margin of -5.26% ([$19M - $20M] / $19M) whereas the approach used in this report will calculate a margin of -5.0% ([$19M – $20M] / $20M). However, in the kinds of extreme situations which often face small hospitals, particularly with individual payers, the results of using the two approaches are very different, and the approach used in this report leads to a more easily understandable result. For example, if a hospital is only receiving revenues sufficient to cover one-half of its costs, the approach used in this report will calculate a margin of -50% (e.g., in the case of the hospital with $20 million in expenses, the margin with $10 million in revenues is calculated as [$10M - $20M] / $20M, or -50%), whereas the standard approach calculates a margin of -100% ([$10M – $20M] / $10M). If the hospital receives no revenues at all to cover a particular set of costs (e.g., for the costs associated with uninsured charity care patients), the approach used in this report calculates a margin of -100%, whereas a margin cannot be calculated under the standard approach because the denominator would be zero. Similarly, if a hospital is receiving payments that are 50% higher than its costs, the approach used in this report calculates the margin as +50% (e.g., [$30M – $20M] / $20M), whereas the standard approach calculates a margin of +33% ([$30M – $20M] / $30M). The standard approach is based on the way profits are calculated for for-profit businesses, which assume that prices are set by the market and businesses must keep their costs below those prices. In contrast, for rural hospitals and other essential community services, the cost depends on the services that need to be delivered, and payments need to be set at amounts sufficient to cover those costs. Consequently, it makes more sense to normalize margins based on costs rather than payments.↩︎
“Current net assets” is defined here as the difference between current assets and current liabilities. The difference is used rather than the more traditional “current ratio,” so that the difference can be compared to the hospital’s margin and total expenses. For example, if the hospital’s current net assets is positive, but the dollar amount is comparable in size to the dollar amount the hospital is losing each year, then continued losses will push the current net assets below zero within the next 1-2 years, and the hospital will likely be unable to pay all of its bills.↩︎
Weber L, Ostrov BF. “Hospital Executive Charged in $1.4B Rural Hospital Billing Scheme.” Kaiser Health News, June 30, 2020.↩︎
Weber L, Ostrov BF. “The Collapse of a Hospital Empire – And Towns Left In The Wreckage.” Kaiser Health News, August 20, 2019.↩︎
Moffeit M. “Bled Dry: How a Hospital Died Under the Care of a Texas Doctor.” The Dallas Morning News, December 2, 2016.↩︎
2020 was an unusual year because the coronavirus pandemic reduced the number of healthcare services delivered by most rural hospitals, which reduced margins on patient services, but rural hospitals also received federal funding, which made total margins higher than they would have been otherwise. 2021 was also unusual because the federal pandemic assistance increased their total margins. Consequently, many hospitals that were losing money prior to 2020 temporarily appeared profitable in 2020 and 2021.↩︎
Small rural hospitals differ significantly in the number and types of services they deliver, which makes it is difficult to compare their “sizes” in an apples-to-apples way. Some studies have attempted to measure the relative sizes of hospitals by combining the numbers of inpatient and outpatient services into a measure of “equivalent discharges,” but Medicare Cost Reports do not include information on the numbers or types of services other than inpatient admissions. Moreover, in order to combine the volumes of different services into a single measure of volume, assumptions must be made about the relative “sizes” of different types of services. Those assumptions are typically based on the relative amounts Medicare pays for services, but that begs the question of whether Medicare payments accurately reflect the cost or intensity of services in small rural hospitals. Because of these problems, the total annual expenses at a hospital is used to compare the sizes of hospitals here.↩︎
Most private health insurance plans require patients to pay co-payments or co-insurance on most of the individual services they receive. They also generally require patients to pay the full amount for most services until a deductible is reached, and many individuals now have “high deductible” plans that cause the patient to be the sole payer for many services.↩︎
Although these additional revenues can offset losses from other payers, the net benefit will be smaller or potentially negative if hospitals have to incur additional costs in order to receive these revenues. For example, some states impose special taxes or fees on hospitals and use the revenues to obtain additional federal Medicaid matching funds. The combined amounts are then distributed to hospitals. If the formula used to distribute the funds gives some hospitals significantly more than the amount they contributed plus matching funds, other hospitals could potentially receive less in funding than they contributed in taxes/fees.↩︎
For Original Medicare beneficiaries, the charges for the services they receive and the amounts Medicare pays for the services are reported separately for inpatient stays and outpatient services and also for services delivered by any Rural Health Clinics, home health agencies, Skilled Nursing Facilities (SNFs), inpatient psychiatric units, and inpatient rehabilitation units operated by the hospital. Payments made to the hospital for services delivered by employed physicians and other services paid on a fee schedule (i.e., not paid for on the basis of cost or through one of the Medicare prospective payment systems) are not reported separately, but this represents only a small portion of the payments associated with Medicare patients.↩︎
Medicaid programs differ from state to state, and different hospitals use different approaches to recording Medicaid revenues. Hospitals that receive Medicaid Disproportionate Share (DSH) payments sometimes report those as part of the Medicaid payments for individual services, and sometimes report them as “Other Income.” In addition, it appears that some hospitals have not reported all payments from Medicaid Managed Care Organizations (MCOs) as “Medicaid” payments, particularly in the initial years when a state transitioned to an MCO structure, so a small portion of the “Private/Other” category in this report may consist of Medicaid MCO payments.↩︎
The “net revenue” from a payer is the gross charges the hospital bills for services delivered to that payer’s patients minus the discounts and adjustments that are required under the payment schedule or contract with that payer. In general, net revenue represents the payers’ “allowed amounts” for services minus any unpaid patient cost-sharing.↩︎
Although payments from Medicare Advantage (MA) plans are often classified as “public” or equated with Medicare, these plans can set or negotiate rates with hospitals that are higher or lower than what the hospital would receive for Original Medicare beneficiaries and they can establish cost-sharing requirements for patients that are higher or lower than what is required for beneficiaries enrolled in Original Medicare, just as a commercial insurance plan can do.↩︎
For example, this includes payments from the Veterans Administration and Workers Compensation programs. In addition, this category includes services delivered to Original Medicare beneficiaries by employed physicians, ambulance services, and reference laboratory services, since Medicare does not consider these to be “hospital services.” Analysis indicates that for most hospitals, only about 2-3% of the costs and revenues in this overall category will be associated with these services, so profits or losses on them will have little impact on most hospitals’ margins in this category or their overall margins. However, some hospitals, particularly larger hospitals, employ a larger number of physicians and other clinicians (either specialists or primary care providers), and for them, a larger percentage of costs and revenues in this category will represent Original Medicare beneficiaries, particularly if a high proportion of the residents of the hospital’s service area are elderly.↩︎
Self-pay patients are patients who do not have insurance but who do not meet the hospital’s standards for charity care. In addition, this category includes patients who have insurance that does not cover the service the hospital provided. For example, health insurance plans do not typically cover long-term nursing care or assisted living services provided by many small rural hospitals. However, only a small portion of costs and revenues at most rural hospitals are associated with these types of services.↩︎
Hospitals report bad debt separately for Medicare and other payers. The amount described here as “bad debt” represents only the non-Medicare portion of the hospital’s total bad debt.↩︎
Each hospital establishes its own criteria as to which patients qualify for charity care, so losses in this category will vary across hospitals based on both differences in the number of uninsured patients receiving services and differences in the charity care criteria used.↩︎
Since seniors with Medicare Advantage plans are included in the private-payer category, the proportion of services associated with all Medicare beneficiaries (i.e., both those with Original Medicare and those who enrolled in Medicare Advantage) is likely closer to the proportion of services associated with patients who have employer-sponsored insurance, individual insurance plans, or who pay for services directly. However, the percentage of individuals eligible for Medicare who enroll in Medicare Advantage plans varies significantly from state to state and from county-to-county within states, so the percentage of services to seniors that are in the Medicare category vs. the Private Payer category can vary significantly for individual hospitals.↩︎
If a patient needs drugs or a lab test during the ED visit, those costs will be assigned to other cost centers.↩︎
For example, if one payer’s patients received $200,000 in ED services and $100,000 in lab tests, while a second payer’s patients received $100,000 in ED service and $200,000 in lab tests, then using a service-line specific approach, the estimated cost of services for the first payer would be $125,000 (0.5 x $200,000 + 0.25 x $100,000), whereas the estimated cost for the second payer would be $100,000 (0.5 x $100,000 + 0.25 x $200,000). However, if the overall cost-to-charge ratio for the hospital is 0.35 (the overall ratio will always be somewhere inside the range of the individual cost-to-charge ratios) then each hospital would be assigned a cost of $105,000 (0.35 x $300,000), which is too little for the first payer and too much for the second.↩︎
Kronick R, Neyaz SH. Private Insurance Payments to California Hospitals Average More Than Double Medicare Payments. West Health Policy Center (May 2019).↩︎
For example, if a hospital uses a higher mark-up in setting charges for x-rays than for CT scans, using the average cost-to-charge ratio for the radiology department will cause costs to be overestimated for x-rays and underestimated for CT scans. Some hospitals use a separate cost center for CT scans that allows different cost-to-charge ratios to be calculated and used for estimating costs, but others do not.↩︎
The cost of services for the Private/Other category is estimated by taking the total cost of patient services at the hospital and subtracting the portion of the cost that is attributed to Original Medicare patients, Medicaid patients, CHIP and indigent care patients, and uninsured charity care patients based on the charges billed for those patients. The estimated cost of bad debt is added to the estimated revenue for the Private/Other category before calculating the margin in that category, so that it represents the amount of profit or loss the hospital would have received if patients (other than patients qualifying for charity care) had paid what they owed. This avoids double-counting with the Bad Debt category (where the margin is calculated by subtracting the cost of bad debt from zero). In other words, the Private margin represents the profit or loss associated with the “allowed amount” of payment for patient services and the Bad Debt margin represents the loss on the services and portions of services for which patients failed to pay. The sum of the margins in these two categories represents the total net margin for privately insured and self-insured patients, i.e., the actual payments received for the services minus the cost of the services.↩︎
Mathematically:
Category-Specific Dollar Margin =
Revenue in the Category – Estimated Cost of Services in the Category;
Category-Specific Percentage Margin =
Category-Specific Dollar Margin / Estimated Cost in the Category.↩︎Mathematically:
Contribution to Total Margin =
Category-Specific Dollar Margin / Total Hospital Expenses.↩︎For example, imagine a hypothetical hospital with a -6% total margin that has two payers. The margin on Payer A’s patients is -10% (i.e., Payer A pays 10% less than the cost of the services its patients received) and the margin on Payer B’s patient is -5%. Payer A might appear to be the biggest cause of the hospital’s overall loss, but if Payer A represents only 20% of the hospital’s patients/costs and Payer B represents 80% of the patients/costs, then Payer A will contribute -2% to the hospital’s total margin (20% of costs times payments that are 10% below costs), and Payer B will contribute -4% (80% x -5%), so Payer B is actually causing the majority of the hospital’s loss.↩︎
State Medicaid programs are also required to have special payment arrangements for RHCs. They generally pay more for RHC visits than other primary care visits, although not necessarily enough to cover costs. “Payment for Services Provided by Federally-Qualified Health Centers and Rural Health Clinics,” Social Security Act §1902(bb).↩︎
Hospitals also incur bad debt for Original Medicare patients. At larger hospitals, Medicare patients are required to pay 20% of the total payment allowed by Medicare for most outpatient services after meeting a deductible, but at Critical Access Hospitals, the beneficiaries are required to pay 20% of the hospital’s charges for services, which will generally be a higher amount. Some Medicare beneficiaries have a supplemental insurance plan, but the majority do not, and some of these individuals may not be able to afford to pay some or all of the cost-sharing amount. However, Medicare reimburses hospitals for about 2/3 (65%) of the bad debt for Original Medicare beneficiaries, so bad debt losses for Original Medicare patients are generally much less than the bad debt losses for privately-insured patients.↩︎
Bad debt represents the estimated cost of the service the patient received but failed to pay for. The hospital reports the charges for the services the patient received but did not fully pay for, and that is then converted into an estimated cost using the cost-to-charge ratios at the hospital; any payment actually received is subtracted from that amount. However, a portion of bad debt represents patients who have failed to pay for their cost-sharing, even though their insurance paid the remaining amount for the service, and so the amount assigned to this will depend on how the hospital determines the amount of charges that it assigns to bad debt.↩︎
The “cost” of bad debt for insured patients is estimated based on the charges for services, and it may be higher or lower than the actual cost of services.↩︎
At rural hospitals, a median of 89% of the total amounts unpaid by patients is bad debt rather than amounts for patients with insurance who qualify for charity care, and at the smallest rural hospitals (i.e., those with total expenses less than $20 million per year), the median is 98%.↩︎
State Health Access Data Assistance Center (SHADAC). New 2018 State-Level Estimates of Medical Out-of-Pocket Spending for Individuals with Employer-Sponsored Insurance Coverage. (February 2020).↩︎
Figure 17 shows the percentage profit or loss on the costs of services for each payer’s patients, whereas Figure 18 shows the contribution each payer makes to the hospital’s overall profitability. The numerator (the dollar profit or loss) is the same in both cases, but in Figure 17 the denominator is the cost of the hospital’s services only for that payer’s patients, whereas in Figure 18 the denominator is the hospital’s total expenses.↩︎
Although it is generally assumed that all hospitals use profits on private-pay patients to offset losses on Medicaid service patients, Figure 17 shows that this “cost-shifting” cannot occur in most of the smallest rural hospitals because there are no profits on the private-pay patients. This difference has not been identified in other analyses of cost-shifting because most analyses do not distinguish between urban and rural hospitals, and none have distinguished between small rural hospitals and larger rural hospitals.↩︎
83% of small rural hospitals are classified as Critical Access Hospitals, whereas the majority of larger rural hospitals have other special payment classifications (Sole Community Hospital, Medicare Dependent Hospital, or Low-Volume Hospital).↩︎
Because fiscal years end at different times for different hospitals, the pandemic started during the last quarter of the fiscal year for some hospitals and during the first half of the fiscal year for others.↩︎
Charges for individual services are typically increased each year to cover higher costs, so a decrease in total charges would mean that the volume of services had decreased by even more.↩︎
Five states (Connecticut, Delaware, Maryland, New Jersey, and Rhode Island) and the District of Columbia had no rural hospitals that had less than $45 million in total expenses prior to the pandemic. Maryland had one rural hospital this small, but it closed in 2020 and so it is excluded from the analyses. Massachusetts and Vermont have only one rural hospital this small, although they have many larger rural hospitals.↩︎
Rural Hospitals and Medicaid Payment Policy. Medicaid and CHIP Payment and Access Commission (August 2018).↩︎
Many states used hospital assessments to help pay for the higher cost of expanded coverage. Marks T et al. Factors Affecting the Development of Medicaid Hospital Payment Policies: Findings from Structured Interviews in Five States. Medicaid and CHIP Payment and Access Commission (September 2018).↩︎
Rural Hospitals and Medicaid Payment Policy. Medicaid and CHIP Payment and Access Commission (August 2018).↩︎
Texas Health & Human Services Commission. Medicaid 1115 Waiver.↩︎
Association of Washington Public Hospital Districts. http://www.awphd.org.↩︎
A small portion of this category represents payments from other government programs, such as the Veterans Administration and Workers Compensation programs, and Original Medicare payments for services that are not considered to be “hospital services,” such as services delivered by employed physicians, ambulance services, and reference laboratory services.↩︎
California Office of Statewide Health Planning and Development. Hospital Financials.↩︎
In contrast to Medicare cost reports, which limit “bad debt” to the amounts that patients fail to pay, the California reports include all types of bad debt, including amounts that a health insurance plan was obligated to pay but failed to do so.↩︎
In 2017-18, the majority of Tennessee rural hospitals had less than $32 million in expenses.↩︎
Tennessee Department of Health. Joint Annual Reports.↩︎
White C, Whaley C. Prices Paid to Hospitals by Private Health Plans Are High Relative to Medicare and Vary Widely: Findings from an Employer-Led Transparency Initiative. RAND Corporation (2019).↩︎
The RAND data are based on claims data for approximately 4 million covered lives made available by several dozen self-insured employers, the state All-Payer Claims Databases in Colorado and New Hampshire, and some health plans. This is a large population, but since it represents only about 2% of the U.S. population with employer-sponsored health insurance and since the individuals included are disproportionately concentrated in several states and in self-insured plans, the results based on these data may not be representative of all private payments in all parts of the country. Moreover, even though the data include a large number of individuals and claims for services in aggregate, there are too few services at some hospitals, particularly small hospitals, to allow reliable estimates of payment levels at those hospitals for individual services.↩︎
Because of the small number of claims for individual services available to the RAND researchers and because claims for different sets of services were available at different hospitals, the researchers calculated “standardized” payments for inpatient and outpatient services that would be comparable between different hospitals. The standardized payment was calculated by weighting the actual payment amounts for individual services by the estimated relative costs of those services. The weight for an inpatient admission was based on the relative weight of the applicable Diagnosis Related Group (MS-DRG) in the Medicare Inpatient Prospective Payment System, and for an outpatient service, the weight was based on the relative weight of the associated Ambulatory Payment Classification (APC) in the Medicare Outpatient Prospective Payment System.↩︎
The reasons why costs are higher at smaller hospitals are discussed in detail in the section on Costs↩︎
The estimated Medicare payment in the RAND report was calculated based on the Medicare payment system and parameters applicable to that hospital. For example, payments for a Critical Access Hospital were estimated based on the cost and charges for services at that hospital, whereas payments for other hospitals were based on amounts calculated under the Inpatient Prospective Payment System.↩︎
Change Healthcare Healthy Hospital Revenue Cycle Index, Change Healthcare (June 26, 2017).↩︎
Levinson D. Medicare Advantage Appeal Outcomes and Audit Findings Raise Concerns About Service and Payment Denials. Office of Inspector General, U.S. Department of Health and Human Services Report OEI-09-16-00410 (September 2018).↩︎
Pollitz K, Cox C, Fehr R. Claims Denials and Appeals in ACA Marketplace Plans. Kaiser Family Foundation (February 25, 2019).↩︎
States with state-based exchanges such as California and New York were not included in the analysis.↩︎
Martin J. “Health Plan Credentialing Delays Affect Physicians, Patients.” Texas Medicine 112(11):47-53 (2016)↩︎
Suntay RJ. “3 Reasons Why Physician Credentialing Red Tape Hits Rural PA Especially Hard.” HAP News , October 16, 2019. The Hospital and Healthsystem Association of Pennsylvania.↩︎
Curran D, Hart R, Henderson J, Shaw T. “The Health Care Crisis Texas Isn’t Talking About.” Rural Matters (Fall 2019). Texas Organization of Rural & Community Hospitals.↩︎
Coverage for all of the uninsured charity care patients would reduce the number of hospital with losses by less than 5%, so coverage for a subset of them through Medicaid expansion would eliminate losses at only a few hospitals, and the reduction would be less if the payments for those patients were lower than the cost of services. Only a portion of patient bad debt represents patients who do not have insurance, so the number of hospitals experiencing losses would likely decrease by much less than 12% if they did have insurance.↩︎